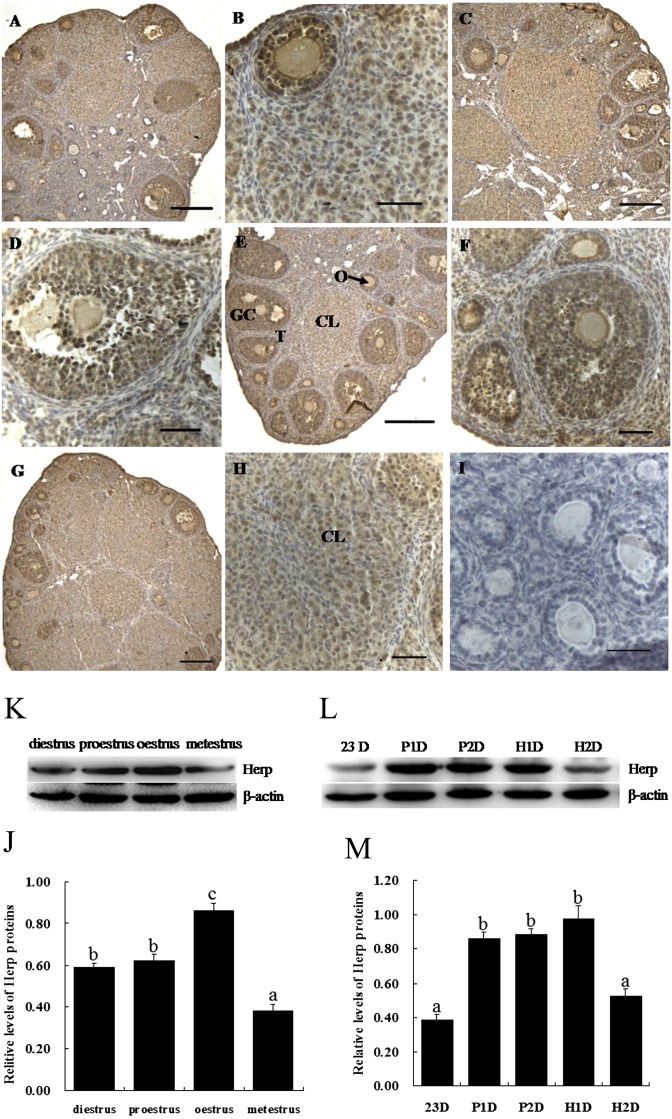
Fig. 1.
Localization and expression of Herp protein in mouse ovaries during the estrous cycle. A and B: diestrus, C and D: proestrus, E and F: oestrus, G and H: metestrus. I: negative control. Positive immunostaining for Herp is indicated by a brown reaction product. GC, granulosa cells; O, oocyte; T, theca cells; CL, corpus luteum. Scale bars, 50 μm (A, C, E, G and I) and 100 μm (B, D, F, and H). J and K: The protein level of Herp in the mouse ovary during the estrous cycle. L and M: The protein level of Herp in the mouse ovary after treatment with PMSG or hCG. P1D and P2D, treated with PMSG for 1 day and treated with PMSG for 2 day, respectively; H1D and H2D, treated with hCG for 1 day after treatment with PMSG for 2 day and treated with hCG for 2 day after treatment with PMSG for 2 day, respectively. Analyses of band intensity on films are presented as the relative ratio of Herp to β-actin. Statistical analysis is shown in the bar graphs. Data are presented as the mean ± SEM. Bars with different letters are significantly different (P < 0.05).

