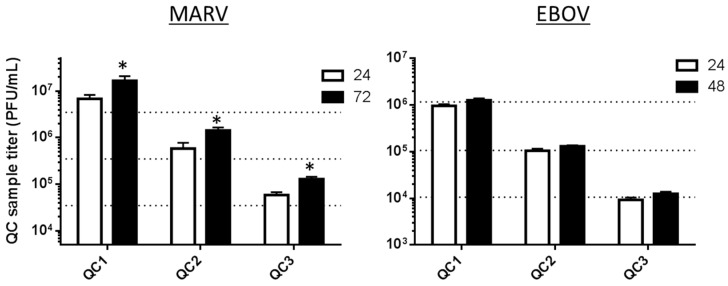
Figure 7.
Use of cells at 24 or 48 h post-seeding provides accurate titer data for the EBOV validated plaque assay, but use at 72 h fails in the MARV assay. The bars represent average measured titers for QC1, QC2 or QC3 for MARV or EBOV, measured on cells plated at 24, 48 or 72 h prior to infection. The three horizontal dotted lines plot the nominal titers of MARV and EBOV QC1, QC2 and QC3. Those nominal titers are presented in Table 1 and Table 2. The * indicates failed runs for MARV tested on cells plated 72 h before use.

