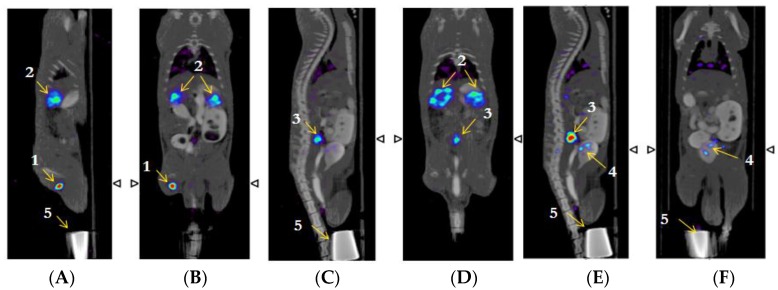
Figure 4.
Biodistribution of β-NTx-DTPA-67Ga by molecular image (SPECT/CT) 3 h post-injection; image representative of four individual experiments. (A) and (B) are sagittal and coronal slices, respectively, showing uptake in the popliteal node (labeled as 1) and kidneys (labeled as 2); (C) is a sagittal slice demonstrating uptake in the lumbar node (labeled as 3); (D) is a different sagittal slice, showing accumulation in lumbar node and kidneys; (E) demonstrates accumulation in lumbar node and bladder (labeld as 4); (F) shows the accumulation in bladder. Number 5 shows the injection site, masked by a lead shield.

