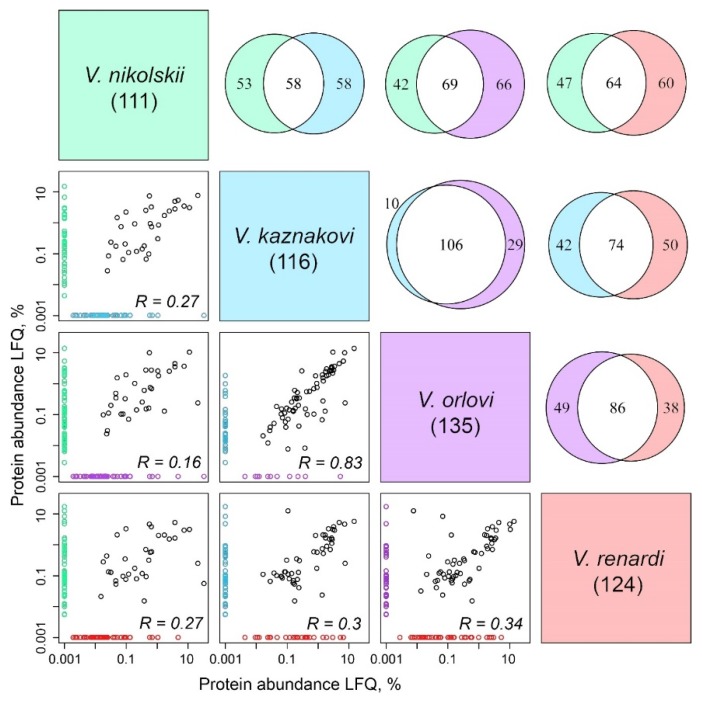
Figure 3.
Protein number and abundance distributions for four Vipera species. ( The panels under the diagonal showing the species names) Individual protein abundance label-free quantification (LFQ) pairwise comparison. Proteins unique for a single species in a pair are highlighted in the corresponding color and for better visualization in logarithmic scale are assigned 0.001% abundance instead of real 0%. (The diagrams above the diagonal showing the species names) Pairwise Venn diagrams showing the number of common and unique proteins for each pair of the venoms.

