Figure 4.
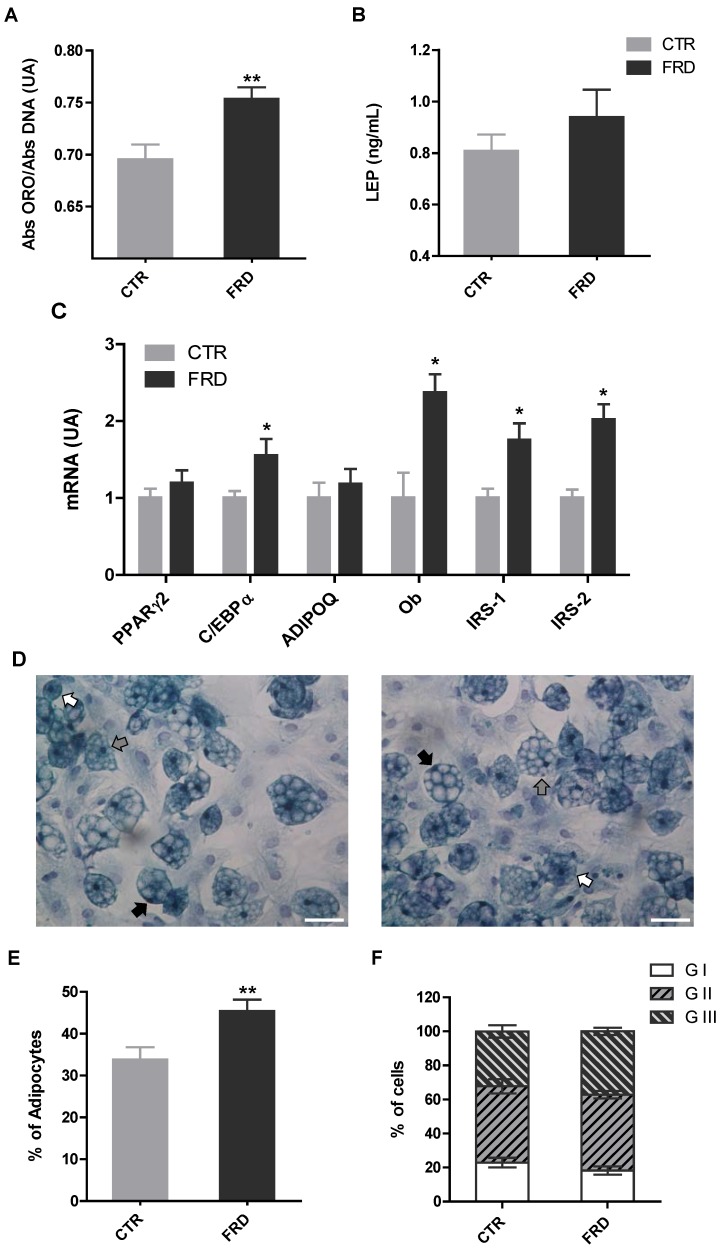
Parameters of terminal adipocyte differentiation. (A) Quantification of intracellular lipid accumulation and (B) leptin cell secretion (n = 5 different experiments with 12 wells per experiment); (C) Gene expression of fully-differentiated adipocyte markers (PPAR-γ2, C/EBPα, Adipoq and Ob, IRS-1 and IRS-2) on Dd 10 in cells isolated from CTR and FRD RPAT pads (n = 5/6 different experiments; AU: arbitrary units); (D) Representative fields containing in vitro differentiated CTR and FRD adipocytes (stained on Dd 10, magnification 40×), displaying different degrees of maturation depending on the nucleus position: GI, central (white arrows); GII, displaced from the center (gray arrows); and GIII: fully peripheral (black arrows). Scale bars at 50 μm; (E) Percentage of differentiated cells according to the presence of lipid droplets; (F) Percentages of cells according to the maturation stage. (n = 4/5 different experiments; data from 200/250 cells were recorded 1 in each experiment). Values are means ± SEM. * p < 0.05 vs. CTR values.

