Figure 9.
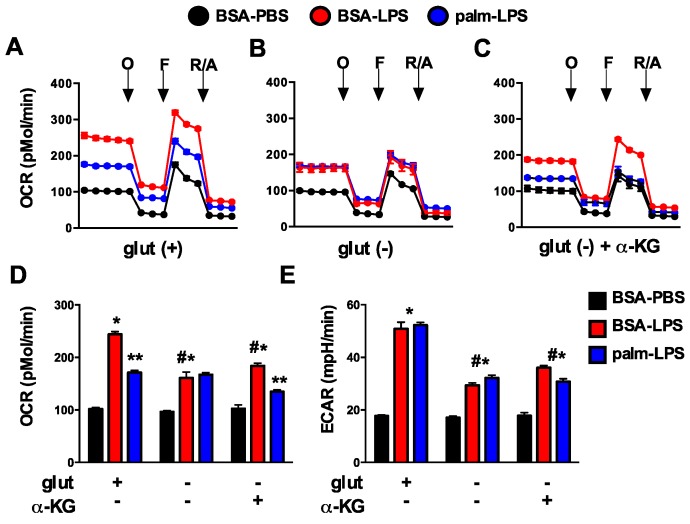
Glutamine deficiency alters mitochondrial metabolism. (A–C) pMACs were stimulated for 16 h with BSA-PBS (black), BSA-LPS (red), or palm-LPS (blue) in glutamine sufficient media (A) or glutamine deficient media ± α-KG (B,C) and mitochondrial metabolism was assessed using a Seahorse flux analyzer. Mitochondrial oxygen consumption rate (OCR) was assessed at baseline and after the injection of oligomycin (O), FCCF (F) and rotenone/antamycin (R/A); (D,E) Baesline OCR (D) or extracellular acidification rate (ECAR; (E)) are reported from cells stimulated as in (A–C). Bar graphs report the mean ± SE for a minimum of 3 experiments, each performed in triplicate. *, p < 0.05 for BSA-PBS vs. BSA-LPS; **, p < 0.05 BSA-LPS vs. palm-LPS; #, p < 0.05 glutamine vs. no glutamine.

