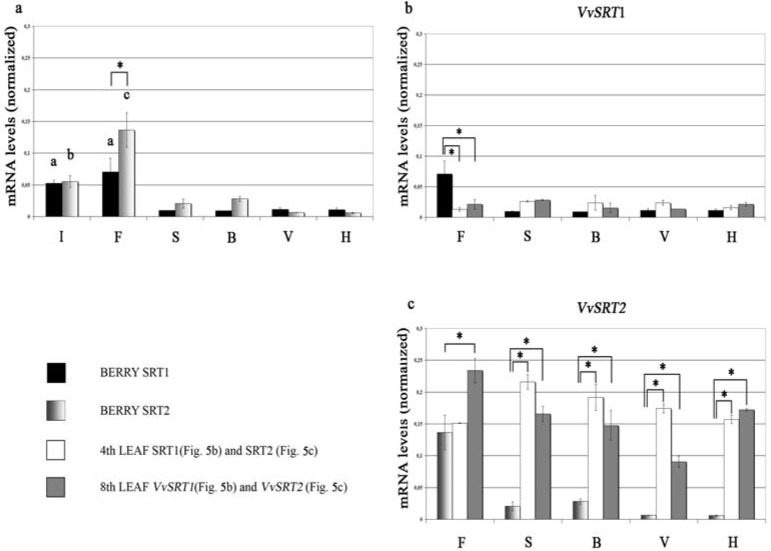
Figure 5.
The expression profiles of the two genes in berries are reported. Grapevine growth stages: I, clear inflorescence; F, start of flowering; S, fruit set; B, pea-sized berries; V, veraison; H, harvest. (a) reports the comparison between the expression profiles of both genes during the different stages. The two genes have similar expression patterns with the exception of the start of flowering, where the expression level of VvSRT2 is significantly higher (c). The expression level of both genes in the early stages is significantly higher than in the remaining stages: VvSRT1 (black boxes) shows no difference between clear inflorescence and the start of flowering (a), while VvSRT2 (shaded grey boxes) shows significant differences between clear inflorescence (b) and the start of flowering (c); (b) reports the expression level of VvSRT1 during the different growing stages in different plant organs: berries (black boxes), fourth leaf (white boxes) and eighth leaf (dark grey boxes); (c) Reports the expression level of VvSRT2 in the different stages and different plant organs: berries (shaded grey boxes), fourth leaf (white boxes) and eighth leaf (dark grey boxes). Error bar indicates ± SD. * p < 0.05 (Post-Hoc with Bonferroni correction). Reproduced from [39] with permission.

