
Figure 1.
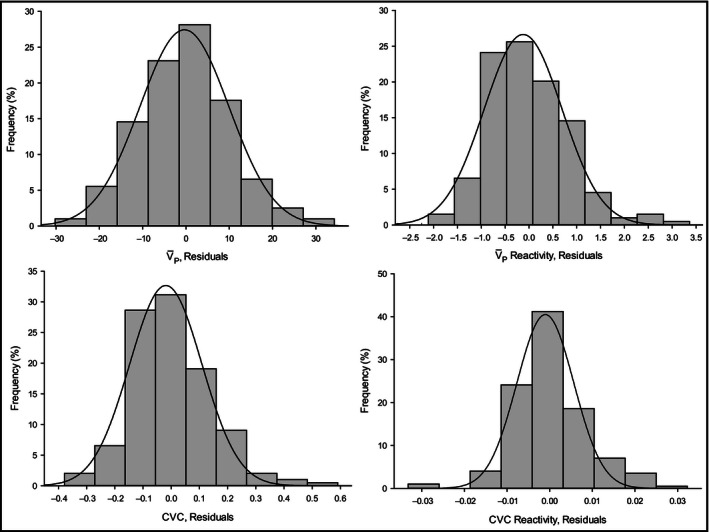
Normality assessment of the cerebrovascular health indices. Histograms display the distribution (frequency, %) of each of the cerebrovascular measure residuals compared to the Normal distribution represented by a solid line. CVC, cerebrovascular conductance (cm/s/mmHg); , resting cerebral blood flow peak velocity (cm/s); ‐reactivity (cm/s/mmHg), cerebral blood flow reactivity to hypercapnic challenge from +1 torr to +8 torr; CVC‐reactivity (cm/s/mmHg/mmHg), cerebrovascular conductance reactivity to a hypercapnic challenge from +1 torr to +8 torr.