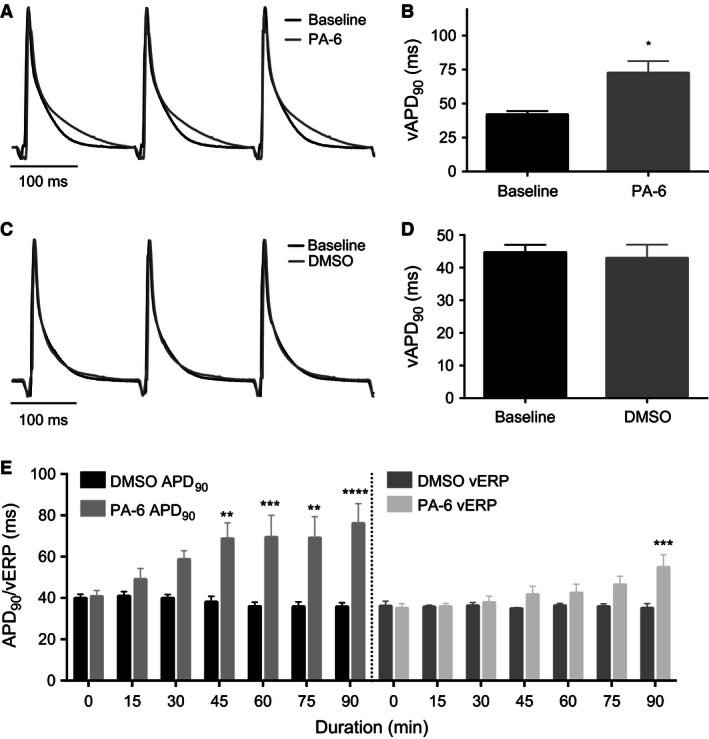
Figure 2.

Effect of PA‐6 on ventricular APD 90. (A) Representative MAP recordings before and after 200 nmol/L PA‐6 application. (B) Summary of vAPD 90 values before and after application of 200 nmol/L PA‐6 at 90 min. Individual data displayed in Figure 3G. Baseline mean 41.8 ± 6.5 msec, PA‐6 application increased to 72.6 ± 21.1 msec, percent‐increase 74% compared to baseline, P < 0.05, n = 6) two‐tailed t‐test, error bars represent mean ± SEM. (C) Representative MAP recordings before and after application of DMSO. (D) Summary of vAPD 90 values before and after application of DMSO at 90 min. Individual data displayed in Figure 3C. Baseline mean 44.6 ± 5.3 msec, DMSO application decreased to 42.9 ± 9.3 msec, n = 5 two‐tailed t‐test, error bars represent mean ± SEM. (E) Time‐dependent change in ventricular APD 90 and ERP following PA‐6 application. 2‐way ANOVA followed by Bonferroni′s MC post test, error bars represent mean ± SEM, n = 5, *P < 0.05 was considered significant. **P < 0.01, ***P < 0.0001.
