
Figure 1.
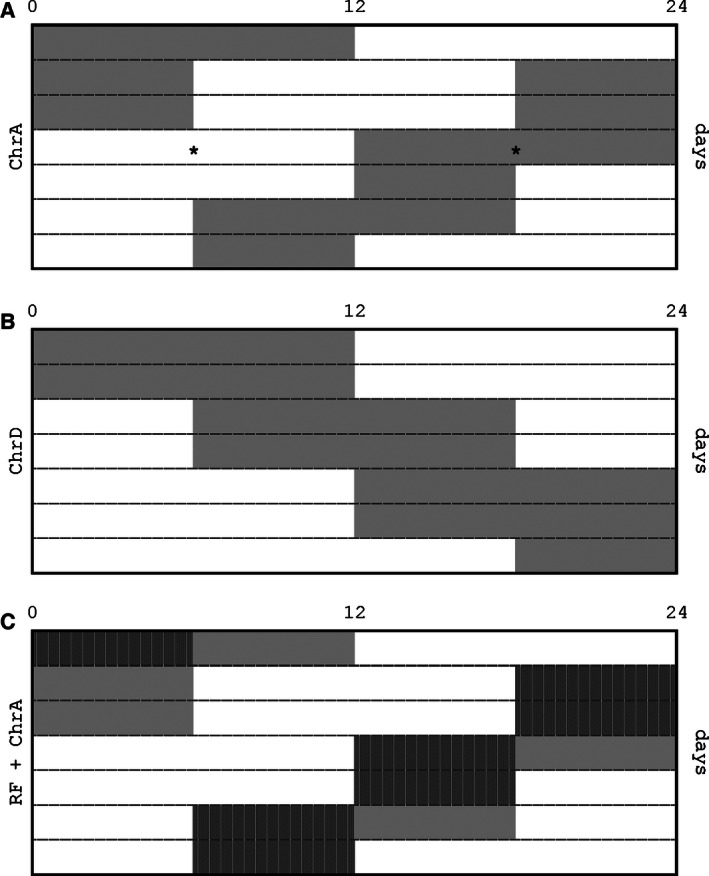
Schematic design of the experimental lightning schedules: each row represents an entire day from 0 to 24 h. Darkness and light periods are indicates by the gray and clear areas, respectively. (A) ChrA consists in the chronic 6 h shortening of every two dark phases. The asterisks exemplify the times across the cycle when blood and tissue samples were obtained. (B) ChrD consists in the chronic 6 h lengthening of every two light phases. (C) RF + ChrA involves the ChrA schedule above with food availability restricted to the first (and in half the cases, only) 6 h of each dark phase (indicated with vertical stripes).