
Figure 3.
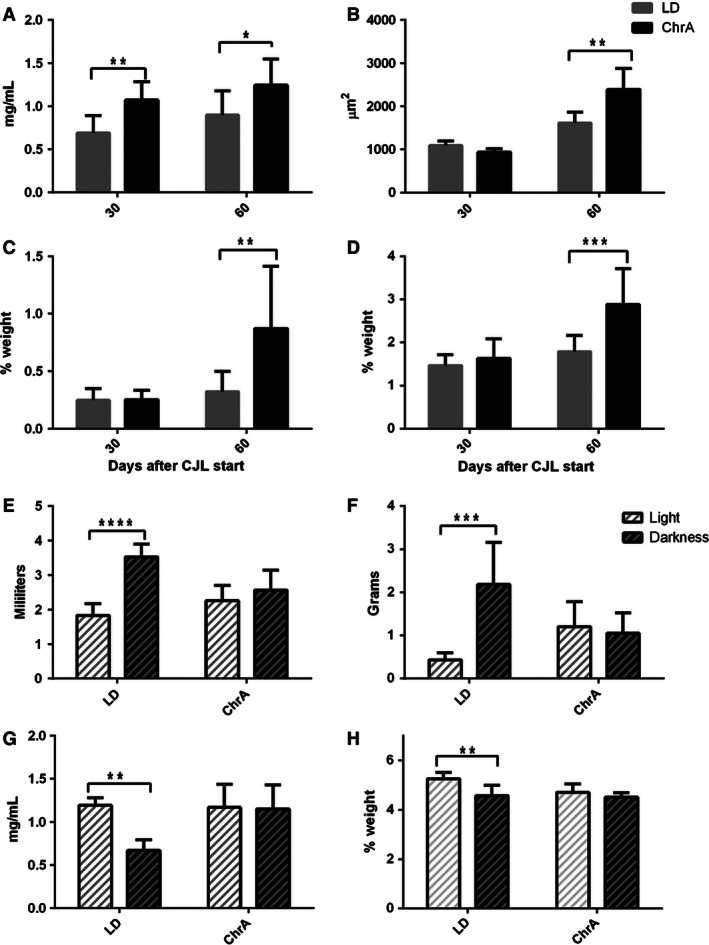
Metabolic variables after 30 and/or 60 days under the ChrA protocol. (A) Triglycerides levels in whole blood at JL30 and JL60 (n = 8 for each bar). (B) Mean retroperitoneal adipocytes area (n = 4 for each bar). (C) Retroperitoneal and (D) epidydimal adipose tissues masses (as % of body weight) (n = 8 for each bar in C–D). (E, F) Total amounts of (E) water and (F) food consumed in average during light and dark phases at JL30 in control and ChrA groups (n = 8 for both groups). (G) Triglycerides levels in whole blood at light and dark phases at JL30. (H) Liver weight (as % of body weight) at light and dark phases at JL30 (n = 4 for each bar in g and h). Two‐way ANOVA analysis was performed in each case, with a posteriori Bonferroni contrasts within levels: 30 and 60 days in A–D; and LD and ChrA in E–H (asterisks indicate significant P values). Two‐way ANOVA results: (A) interaction ns., day P < 0.05, jet‐lag P < 0.001; (B) interaction P < 0.001, day P < 0.0001, jet‐lag P < 0.05; (C) interaction P < 0.05, day P < 0.01, jet‐lag P < 0.05; (D) interaction P < 0.05, day P < 0.001, jet‐lag P < 0.01; (E) interaction P < 0.001, jet‐lag ns., phase P < 0.01; (F)interaction P < 0.0001, jet‐lag ns., phase P < 0.0001; (G) interaction P < 0.05, jet‐lag P < 0.05, phase P < 0.05; (H) interaction ns., jet‐lag P < 0.05, phase P < 0.01.