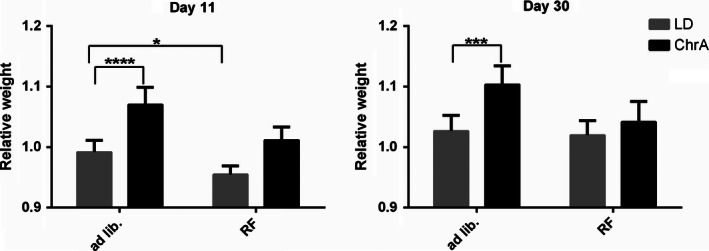
Figure 5.

Relative body weight of animals in the restricted feeding experiment, at days 11 and 30 after the start of the protocols (n = 6 for all groups). Weights were relativized to those of day 0 when protocols, lighting and/or dark phase‐restricted feeding (RF), started. Data was analyzed through two‐way ANOVA at specific time cuts across the experiment. Dunnett contrasts a posteriori against the control group (ad libitum fed LD group) were also performed (asterisks indicate significant P values). Two‐way ANOVA results: Day 11) Weights: interaction ns., feeding P < 0,0001, jet‐lag P < 0,0001; Day 30) Weights: interaction P < 0.05, feeding P < 0,01, jet‐lag P < 0,001.
