
Figure 1.
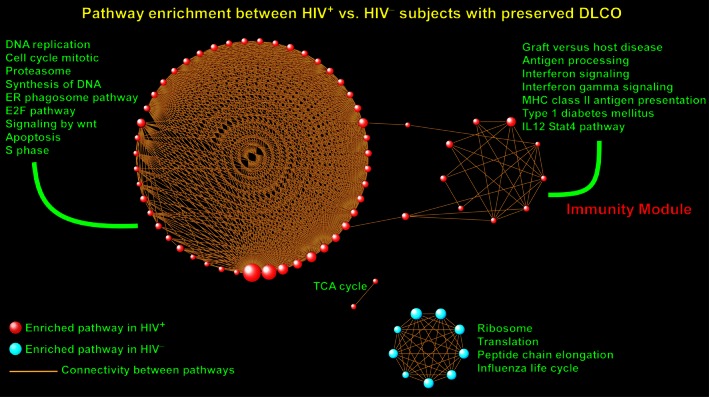
Overview of gene set enrichment analysis between HIV + and HIV – subjects with preserved lung diffusing capacity. A gene set was considered enriched for a given phenotype if most of its member genes were up‐regulated in that condition. In the figure, each sphere designates an enriched pathway with red indicating that its member genes were up‐regulated in HIV + patients and blue indicating that its member genes were up‐regulated in HIV – subjects. The size of each sphere (i.e., gene set) is proportional to the number of its gene members. Since pathways share many common genes, connectivity lines have been used to link these interpathway relationships and define the topology of the enrichment network. Note that pathways aggregated with each other based on extent of overlap among member genes to form larger modules. Selected gene sets have been labeled and an “Immunity Module” identified. Full list of enriched pathways is available in Table S1.