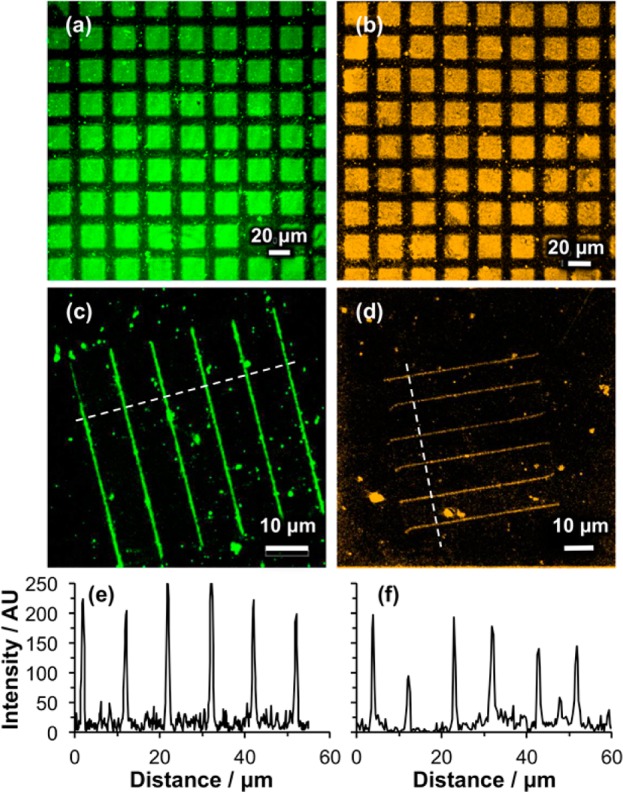
Figure 6.

Confocal fluorescence microscopy images of patterned samples formed by exposure of OEG-NPEOC-APTES through a mask (a,b) and using a near-field probe (c,d) prior to activation of the surface by incubation with GA, ABNTA, and then Ni2+. Panels a and c show samples to which His-GFP has been bound, and samples b and d show samples to which His-CpcA-PEB-PEB has been bound. Representative line sections, measured along the dashed lines marked in panels c and d, are shown in panels e and f.
