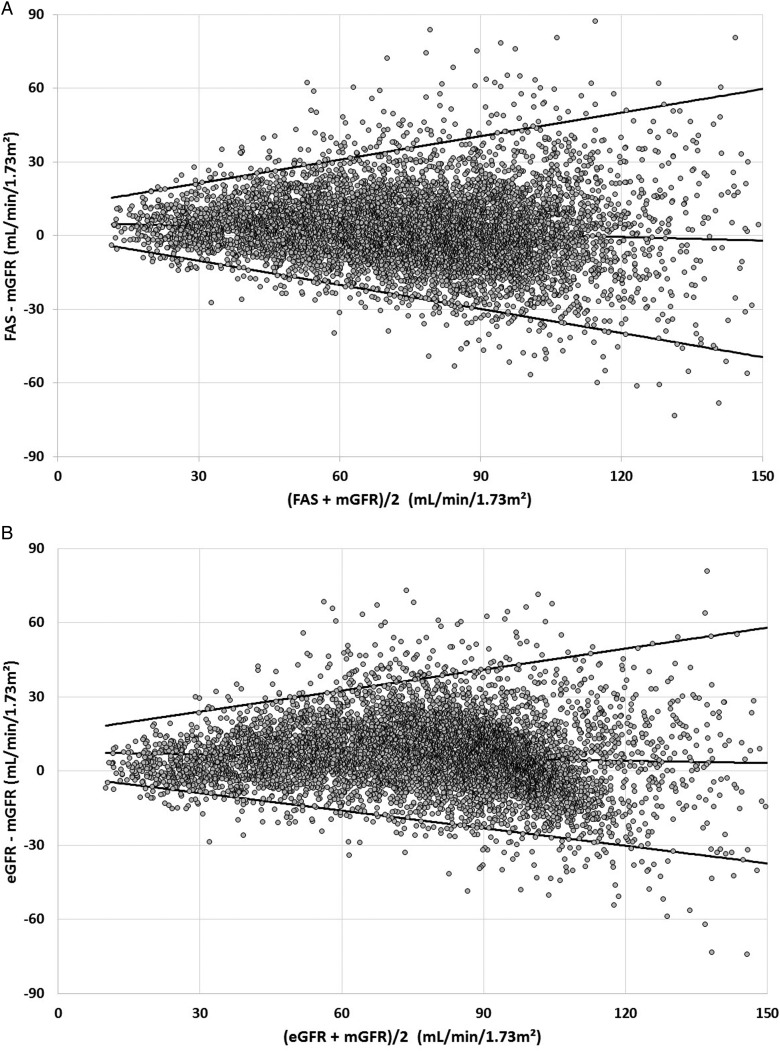
FIGURE 1:
(A) Difference between estimated (FAS equation) and measured GFR versus the average of both methods. Quantile regression lines (2.5th, 50th and 97.5th percentiles) are shown, without excluding any data. Median difference = 1.9 mL/min/1.73 m². (B) Difference between estimated (Schwartz up to age 18 years, CKD-EPI beyond 18 years) and measured GFR versus the average of both methods. Quantile regression lines (2.5th, 50th and 97.5th percentiles) are shown, without excluding any data. Median difference = 5.4 mL/min/1.73 m².

