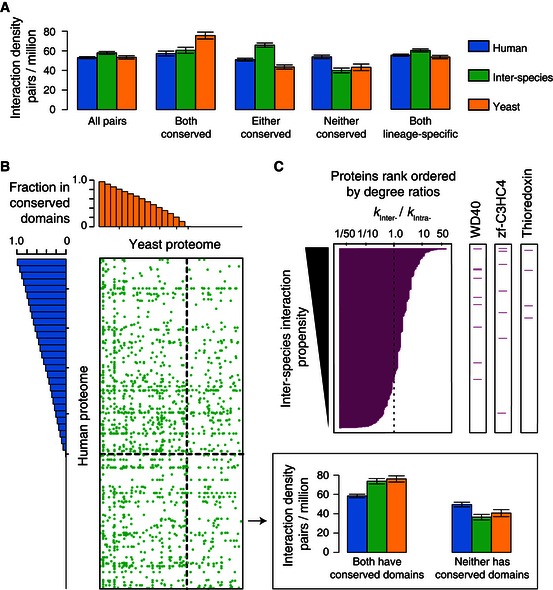
Figure 4. Proteome‐wide distribution of inter‐species interactions.

- Density of interactions within the full search spaces and the subspaces containing conserved or non‐conserved human and yeast proteins. Error bars: standard error of the proportion.
- Proteome‐wide distribution of inter‐species interactions (green dots). Human and yeast proteins are arranged and binned according to the fraction of their sequences found within protein domains present in both yeast and human proteomes. Histograms describe the minimum fractions of sequence in human (left) and yeast (top) proteins within each bin corresponding to protein domains conserved between human and yeast. Dashed line indicates the boundary between proteins with or without protein domains present in both yeast and human proteomes. Inset (top right) shows density of interactions within two subspaces containing proteins with or without conserved domains, respectively.
- Domain‐specific interaction propensity measured by the degree ratio (k inter‐/k intra‐) of individual human or yeast proteins containing each protein domain. Proteins rank ordered by the ratio of their inter‐species over intra‐species degrees (left panel, magenta bars). Magenta lines (three right panels) indicate the rank of human or yeast proteins containing the domains (indicated on top) associated with significantly higher inter‐species interaction propensities. Empirical P‐values obtained by comparing to 10,000 randomized network controls for the three domains are: WD40, 0.02; zf‐C3HC4, 0.04; Thioredoxin, 0.02.
