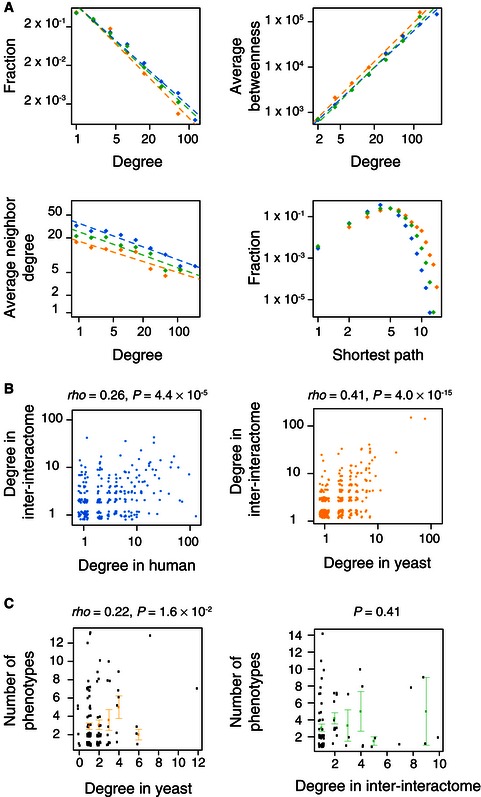
Figure 5. Global network properties of the human–yeast inter‐interactome.

- Topological properties for the inter‐interactome (YHII‐1, green dots) compared to the human (HI‐1, blue dots) and yeast (YI‐1, orange dots) networks.
- Human (left) and yeast (right) proteins have correlated degrees in the inter‐interactome (YHII‐1) and human (HI‐1) or yeast (YI‐1) networks. Spearman's correlations (rho) are shown.
- Numbers of phenotypes associated with deletion of the encoding yeast gene at indicated degree in the yeast (YI‐1, left) and inter‐interactome (YHII‐1, right) data sets. Orange (left) and green (right) dots are averages of black dots at each degree cutoff. Error bars indicate standard error of the proportion. P‐values are for Pearson's correlation test.
