
Fig. 2.
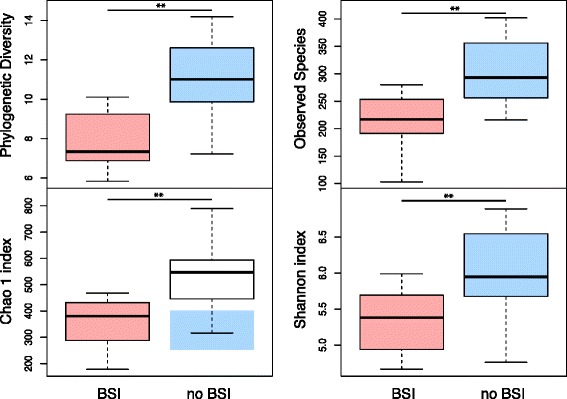
Alpha-diversity indices in samples collected prior to treatment in patients who developed subsequent BSI (red, n = 11) versus samples collected prior to treatment in patients who did not develop subsequent BSI (blue, n = 17), based on phylogenetic and non-phylogenetic richness. Analyses were performed on 16S rRNA V5 and V6 regions data, with a rarefaction depth of 3041 reads per sample. Whiskers in the boxplot represent the range of minimum and maximum alpha diversity values within a population, excluding outliers. Monte-Carlo permutation t-test: *p <0.05; **p <0.01; and ***p <0.001. Boxplots denote top quartile, median, and bottom quartile. BSI, Bloodstream infection. Patients who developed a subsequent BSI had significantly lower microbial richness compared with patients who did not develop subsequent BSI