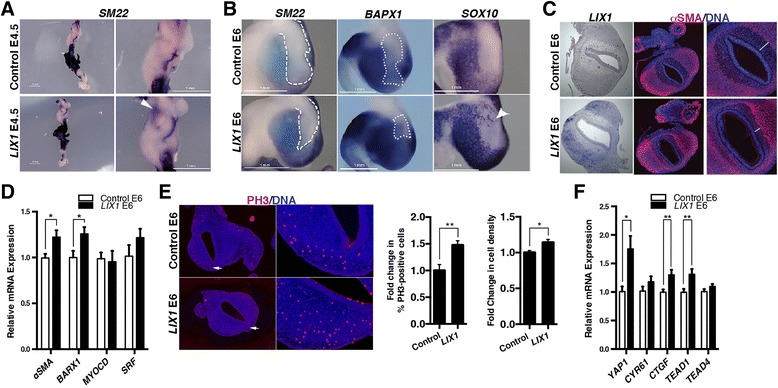
Fig. 3.

LIX1 stimulates YAP1 activity, stomach mesenchymal progenitor proliferation and smooth muscle cell determination. a Whole-mount in situ hybridization of E4.5 gastrointestinal tracts using the SM22 riboprobe. The white arrowhead indicates the premature expression of SM22 in the LIX1-expressing stomach. b Whole-mount in situ hybridization of E6 stomachs using SM22, BAPX1 and SOX10 riboprobes. White dashed lines indicate the position of the intermuscular tendon in the stomach. The white arrowhead indicates the presence of ectopic SOX10-positive cells. Scale bars, 1 mm. c Serial transverse sections of E6 stomachs analysed either by in situ hybridization using the LIX1 riboprobe or by immunofluorescence using anti-αSMA antibodies. Nuclei were visualized with Hoechst. White bars indicate the size of the submucosal domain in each condition. d RT-qPCR analysis of relative mRNA expression in E6 stomachs. Data were normalized to GAPDH expression. Normalized expression levels were converted to fold changes. Values are presented as the mean ± standard error of the mean (SEM) of n = 10 controls vs. n = 12 LIX1-expressing stomachs. *P < 0.05 by one-tailed (αSMA) or two-tailed (BARX1, MYOCD and SRF) Mann–Whitney tests. e Serial transverse sections of E6 stomachs analysed by immunofluorescence using anti-PH3 antibodies. Nuclei are visualized with Hoechst. White arrows in the left panels indicate the area imaged at high power in the PH3 panels. Graph represents the quantification of PH3-positive cells and cell density. Normalized expression levels were converted to fold changes. Values are presented as the mean ± SEM of n = 15 control vs. n = 15 LIX1-expressing stomachs. *P < 0.05; **P < 0.01 by two-tailed Mann–Whitney test. f RT-qPCR analysis of relative mRNA expression in E6 control or LIX1-expressing stomachs. Data were normalized to GAPDH expression. Normalized expression levels were converted to fold changes. Values are presented as the mean ± SEM of n = 10 controls vs. n = 12 LIX1-expressing stomachs. *P < 0.05; **P < 0.01 by one-tailed Mann–Whitney tests
