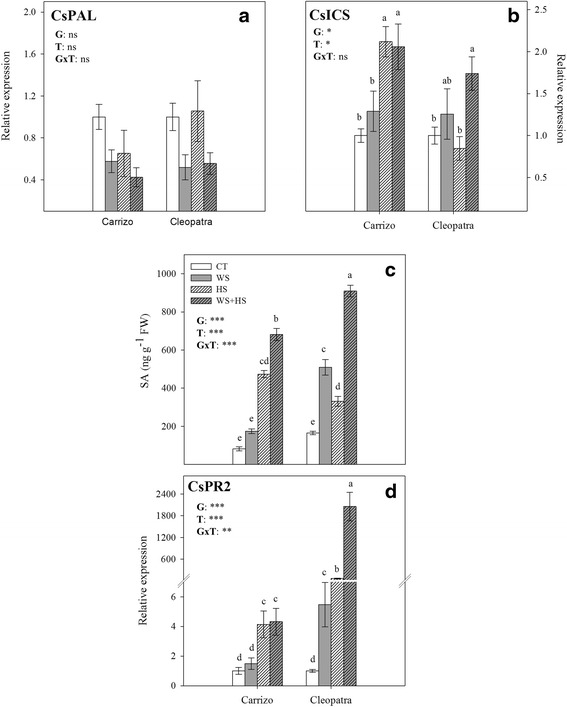
Fig. 5.

Effect of the different stress treatments on metabolism and signaling of SA. CsPAL (a) and CsICS (b) relative expression, SA concentration (c) and CsPR2 (d) relative expression in Carrizo and Cleopatra plants subjected to drought (WS), heat (HS) and their combination (WS + HS). Different letters denote statistical significance at p ≤ 0.05. G: genotypes; T: stress treatment; GxT: interaction genotype x stress treatment. *P < 0.05; **P < 0.01; ***P < 0.001; ns: no statistical differences
