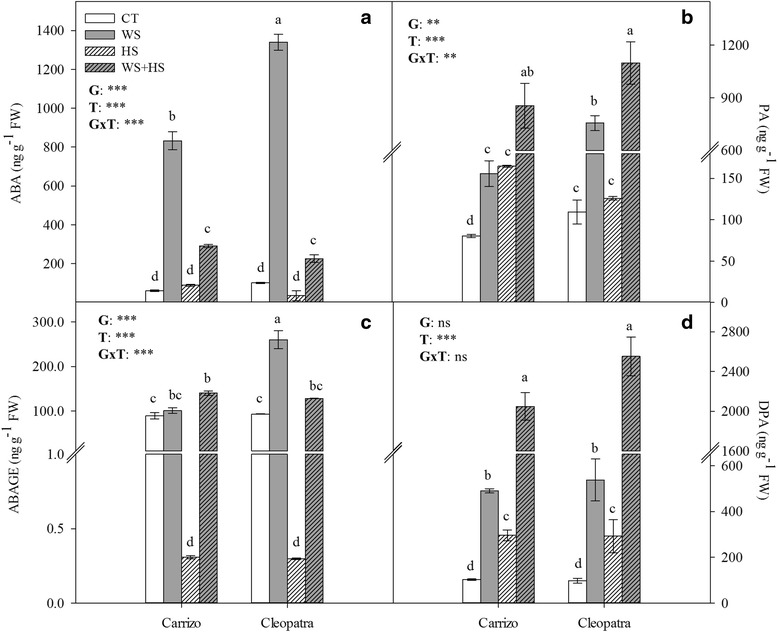
Fig. 6.

ABA, ABAGE, PA and DPA levels in citrus plants subjected to different stress treatments. ABA (a), ABAGE (c), PA (b) and DPA (d) levels in Carrizo and Cleopatra plants subjected to drought (WS), heat (HS) and their combination (WS + HS). Different letters denote statistical significance at p ≤ 0.05. G: genotypes; T: stress treatment; GxT: interaction genotype x stress treatment. *P < 0.05; **P < 0.01; ***P < 0.001; ns: no statistical differences
