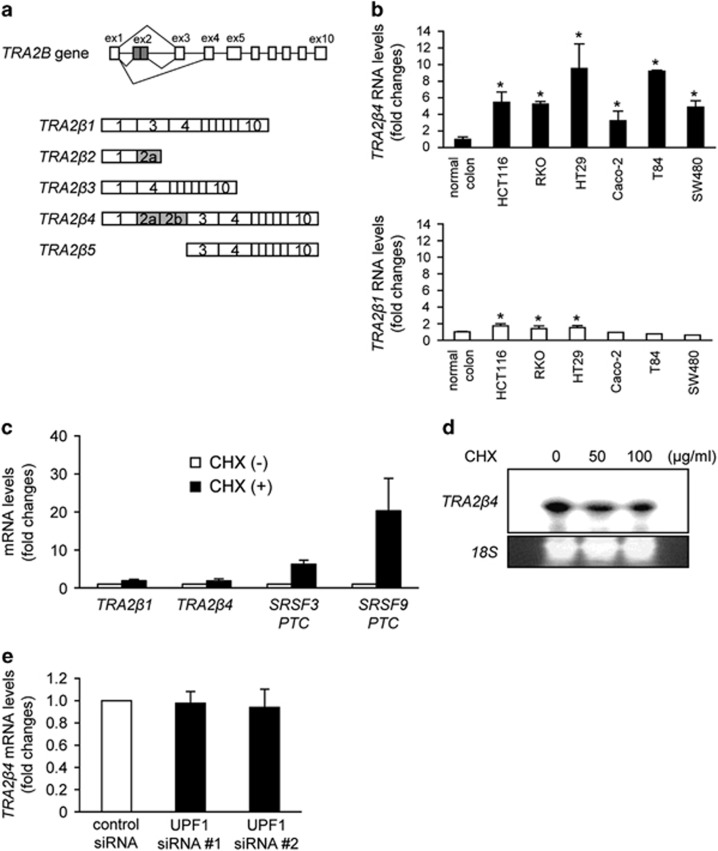
Figure 1.
Expression of TRA2β1 and TRA2β4 in colon cancer cell lines. (a) Schematic diagram of the human TRA2B gene. Exons (ex) are indicated by open boxes and Arabic numbers. Filled boxes denote the ultraconserved exon 2. Five splice variants generated from TRA2B and the use of each exon are shown. (b) Amounts of TRA2β4 (upper panel) and TRA2β1 (lower panel) mRNAs in normal human colon and colon cancer cell lines (HCT116, RKO, HT29, Caco-2, T84 and SW480) were measured by qPCR using GAPDH mRNA as an endogenous quantity control. Values are means±s.d. from three independent experiments. *Significantly different by analysis of variance (ANOVA) and Bonferroni test (P<0.05). (c) HCT116 cells were treated with 10 μg/ml cycloheximide (CHX) for 4 h to inhibit NMD. Then, changes in mRNA levels of TRA2β1, TRA2β4, SRSF3 PTC and SRSF9 PTC were measured by qPCR using GAPDH mRNA as an endogenous quantity control. Values are means±s.d. from three independent experiments. (d) After treatment of HCT116 cells with 50 or 100 μg/ml CHX for 4 h, TRA2β4 levels were assayed by Northern hybridization with a locked nucleic acid (LNA) probe targeting for exon 2. 18S rRNA was used as a loading control. (e) After treatment of HCT116 cells with 10 nm of two different UPF1 siRNAs for 48 h, changes in TRA2β4 mRNA levels were measured by qPCR using GAPDH mRNA as an endogenous quantity control. Values are means±s.d. from three independent experiments.

