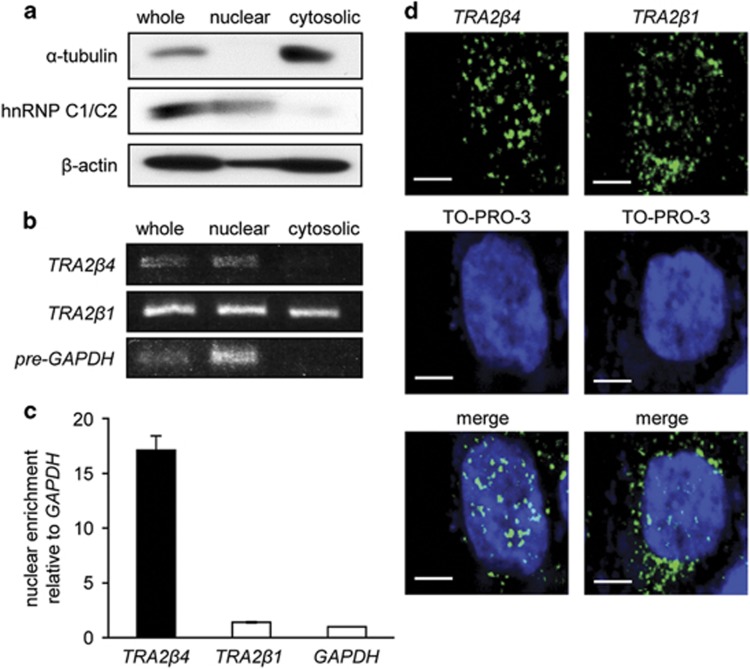
Figure 2.
Subcellular distribution of TRA2β4 in HCT116 cells. (a) After nuclear and cytosolic fractions were prepared from HCT116 cells, the purity of each fraction was monitored by measuring a cytosolic protein (α-tubulin) and a nuclear protein (heterogeneous nuclear ribonucleoprotein (hnRNP) C1/C2) by western blotting. (b) Total RNA was extracted from each fraction and TRA2β1 mRNA or TRA2β4 was amplified by RT–PCR using specific primer sets. The purity of each faction was also assessed by RT–PCR measurement of GAPDH pre-mRNA. (c) TRA2β1, TRA2β4 and GAPDH mRNA levels in each fraction were measured by qPCR. Nuclear-to-cytosolic distribution ratio of each mRNA was calculated. Nuclear enrichment of TRA2β1 mRNA or TRA2β4 is indicated by comparing values to nuclear/cytosolic distribution ratio of GAPDH mRNA. Values are means±s.d. from three independent experiments. (d) Subcellular localization of TRA2β4 and TRA2β1 mRNA in HCT116 cells was examined by RNA fluorescence in situ hybridization (RNA-FISH) using locked nucleic acid (LNA) probes against exon 2 and exon 1–3 junction of TRA2β1 mRNA (green), respectively, as described in Materials and methods section. Cells were counterstained with TO-PRO-3 (blue). Scale bars, 5 μm.

