Figure 3.
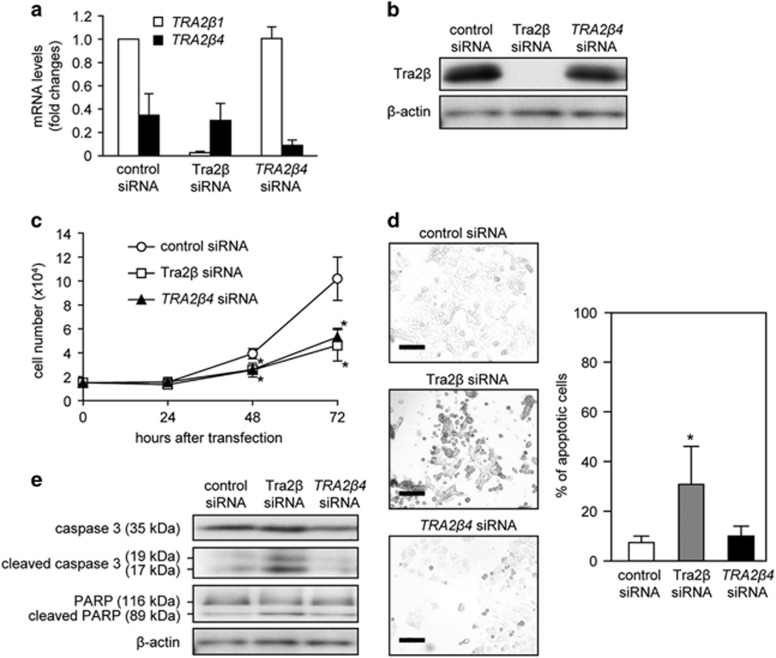
Effect of TRA2β4 silencing on cell proliferation and apoptosis. (a) After HCT116 cells were treated with 10 nm of TRA2β4 or Tra2β siRNA for 48 h, TRA2β1 mRNA and TRA2β4 levels were measured by qPCR using GAPDH as an endogenous quantity control. Values are means±s.d. from six independent experiments. (b) HCT116 cells were treated with 10 nm TRA2β4, Tra2β or control siRNA for 48 h, and then the amounts of Tra2β were measured by western blotting using β-actin as a loading control. (c) HCT116 cells (1.5 × 10⁴ cells) were seeded in 35-mm-diameter dishes and transfected with 10 nm TRA2β4, Tra2β or control siRNA. Subsequently, growing cells were harvested and counted at the indicated times. Values are means±s.d. from four independent experiments. *Significantly different by analysis of variance (ANOVA) and Bonferroni test (P<0.05). (d) After HCT116 cells were treated with 10 nm TRA2β4, Tra2β or control siRNA for 24 h, they were labeled using the DeadEnd Colorimetric TUNEL system (left panels), and the percentages of TUNEL-positive cells were determined (right panel). Values are means±s.d. from three independent experiments. *Significantly different by ANOVA and Bonferroni test (P<0.05). Scale bars, 50 μm. (e) After treatment of HCT116 cells with 10 nm TRA2β4, Tra2β or control siRNA for 48 h, whole-cell lysates were prepared from these cells. The levels of unprocessed or cleaved caspase-3 and PARP were measured by western blotting using β-actin as a loading control.

