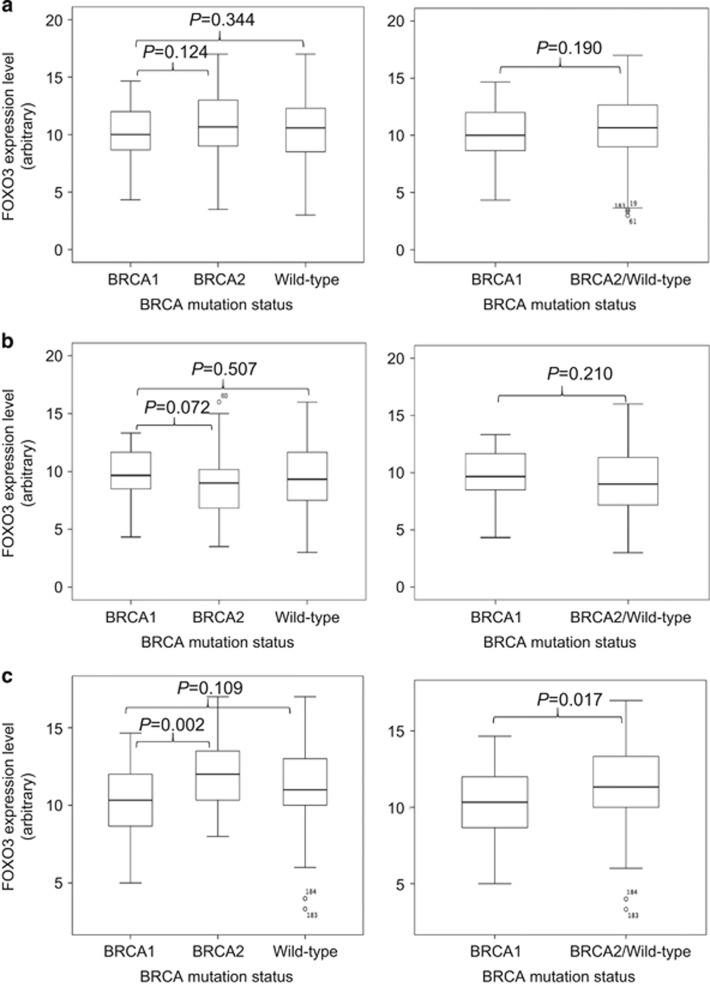
Figure 12.
FOXO3 and EZH2 expression levels in breast cancers with different BRCA mutation. (a) Comparison of FOXO3 expression levels with different BRCA mutation status by Mann–Whitney U-rank test using all samples. (b) Comparison of FOXO3 expression levels with different BRCA mutation status using samples that express low levels of nuclear EZH2 by Mann–Whitney U-rank test. (c) Comparison of FOXO3 expression levels with different BRCA mutation status compared using samples that express high levels of nuclear EZH2 by Mann–Whitney U-rank test.

