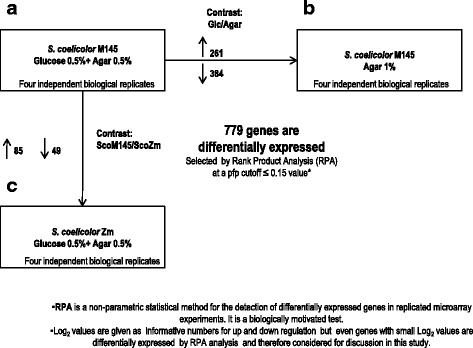
Fig. 1.

Scheme showing the number of differentially expressed genes in comparisons between strains and carbon sources. Orientation of the longer arrows shows the comparison between both conditions. Differential transcription values were obtained by Rank product analysis at a pfp cutoff ≤ 0.15 value. The small arrows up or down oriented indicate the number of genes up or down-expressed in each condition, respectively. a ScoM145 strain grown under repressive conditions. b ScoM145 strain grown under non-repressive conditions. c ScoZm mutant grown under repressive conditions
