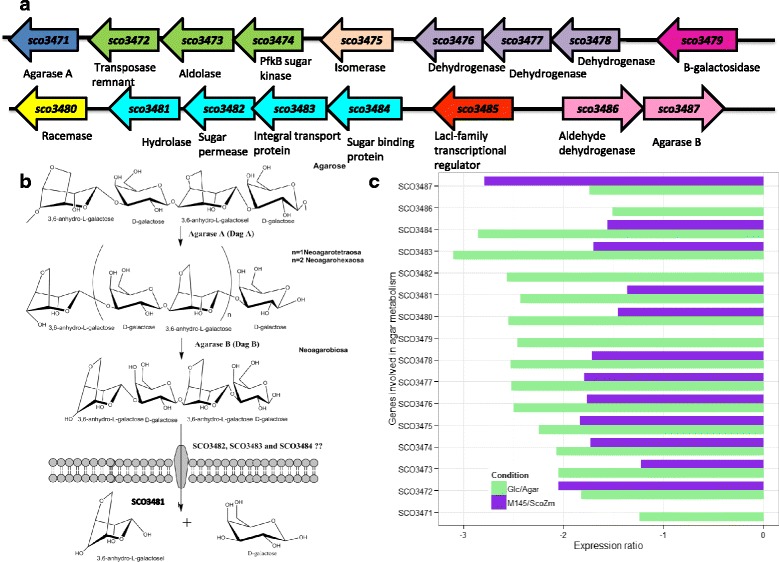
Fig. 5.

a Genomic context of a cluster possible involved in agar degradation. b The Agar metabolism. c Average expression changes observed among experimental conditions. Glc/Agar comparison reflects the glucose effect and M145/ScoZm comparison shows the Glk dependence (green bars). The comparison between these conditions is indicated as ratios of Glc/Agar (carbon dependence) and ScoM145/ScoZm (Glk dependence in purple bars). Results are given as the log2 ratio, thus a positive number indicates up-regulation and a negative number down-regulation, respectively
