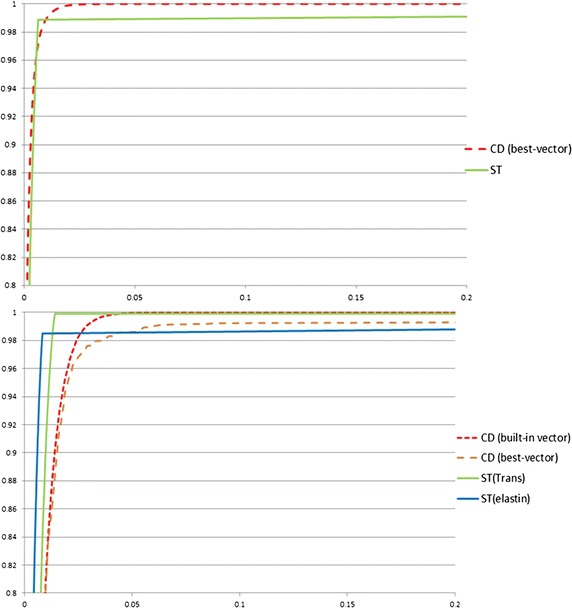
Fig. 8.

ROC curves for CD and ST model for the PSR and elastin datasets. Plot at the top is the ROC for pink colour detection on PSR stained images, the ROC curve for CD with best-vector (CD(best-vector)) is red dashed line, the ROC curve for ST model with PSR stained training images (ST) is smooth green line; The plot at the bottom is the ROC for brown colour detection on DAB stained elastin images, The ROC curve for CD with built-in vector (CD(built-in)) is red dashed line, the ROC curve for CD with best-vector (CD(best-vector)) is orange dashed line, the ROC curve for ST transferred model (ST(trans)) is smooth green line, and the ROC curve for ST model with DAB stained elsatin training images (ST(elastin)) is smooth blue line. The horizontal axis is false-positive ratio and vertical axis is true-positive ratio
