
Fig. 2.
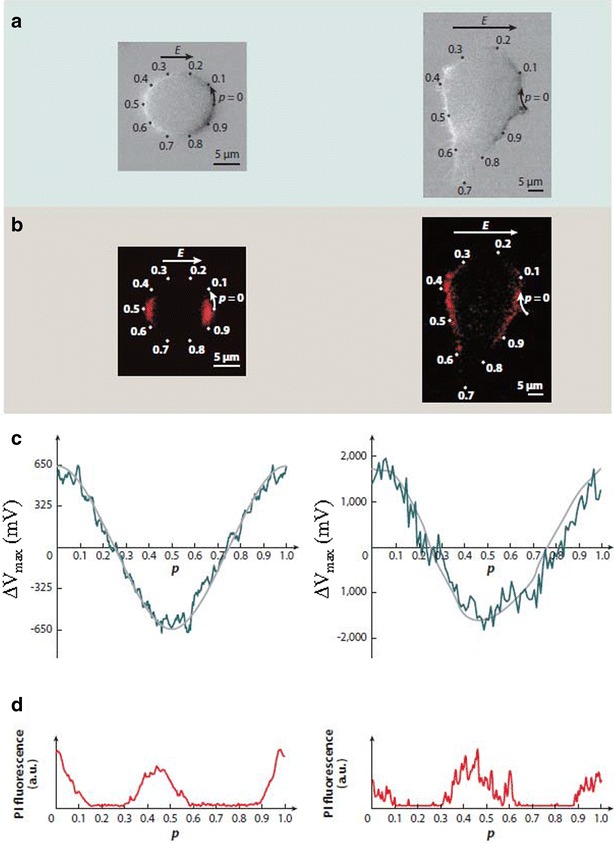
E.g., of the electric field-induced transmembrane voltage (TMV). Two Chinese hamster ovary (CHO) cells in a physiological medium were exposed to the electric fields. One cell has an almost spherical geometry (left-hand sides of panels a–d) and was suspended. This cell was exposed to non-porating single 50-ms, 100-V/cm pulse. The second cell is irregularly shaped and is attached (right-hand sides of panels a–d). This cell was electroporated by a single 200-μs, 1000-V/cm pulse. a Membrane depolarization and hyperpolarization as detected with changes in the fluorescence of di-8-ANEPPS, a potentiometric dye reflecting the TMV. E is the strength of the electric field, p is the axes of rotational symmetry of the cell. b PEF mediated influx into the cell as detected with fluorescent dye propidium iodide (PI) as imaged 200 ms after exposure. c Measured (green) and predicted by numerical computation (gray) TMV. d PI signal. P shows a normalized arc length along the membrane