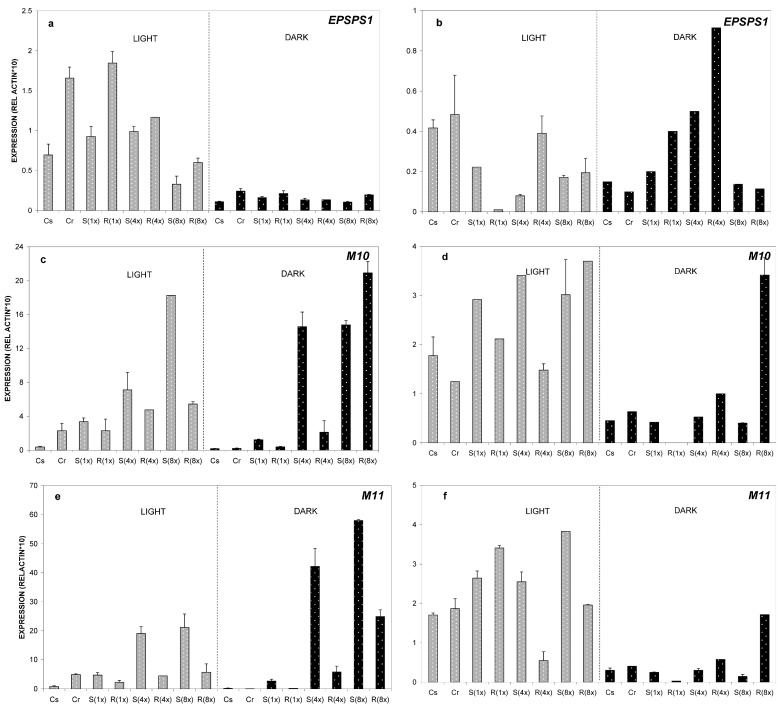
Figure 4.
Relative expression of EPSPS1 (a,b), M10 (c,d), and M11 (e,f) genes analyzed by real time PCR. Relative quantification was obtained through the 2ΔΔCt method using actin as the reference gene. As a reference sample the untreated (control) plants from the susceptible biotype, was chosen (Cs). Data represent the average from three biological replicates and the error bars indicate the standard deviation. Leaves were collected from plants grown at 8 °C. Explanation of samples abbreviations was given on Figure legend 2. Relative expression ratios were estimated one and four days after glyphosate treatment (one DAT—diagrams on the left, and four DAT—diagrams on the right).

