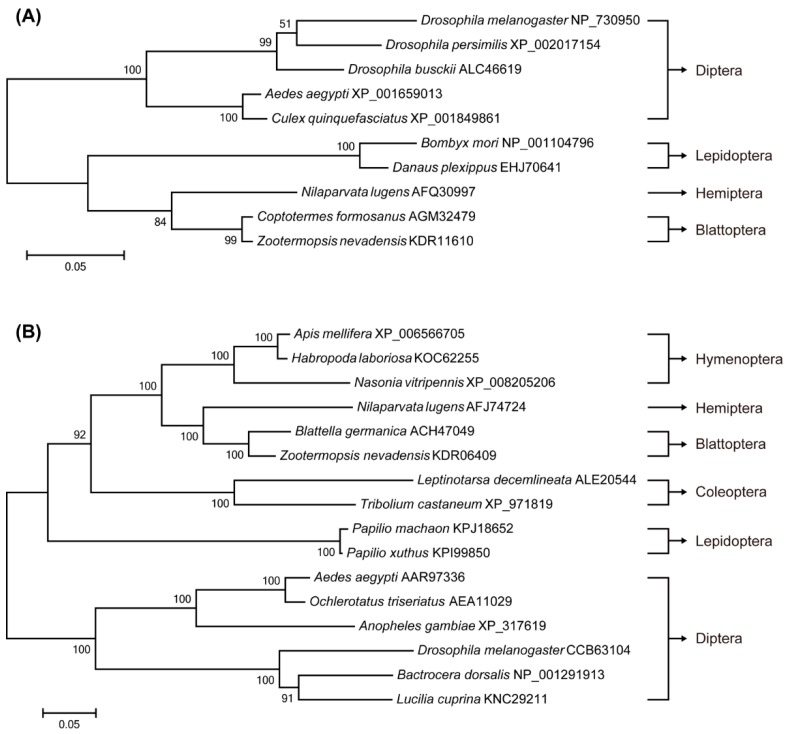
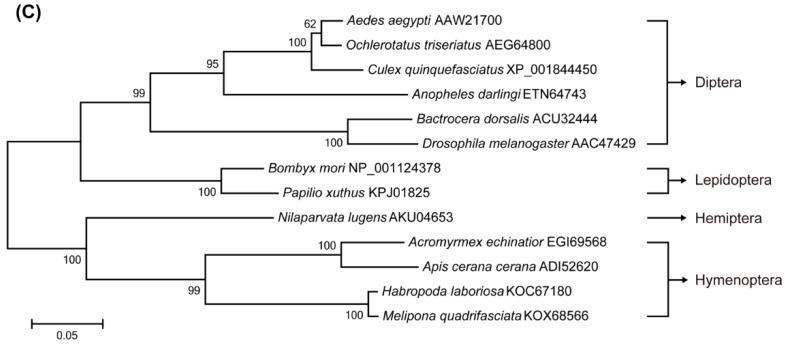
Figure 1.
Phylogenetic analysis of Rheb (A), target of rapamycin (TOR) (B) and S6K (S6 kinase) (C) in insects. The tree was constructed by MEGA6 with the Maximum Likelihood method based on the amino acid sequences alignment [30]. Bootstrap test with 1000 replicates was used to analyze the evolutionary relationship and bootstrap values were shown in the cladogram. The scale bar indicates genetic distance.


