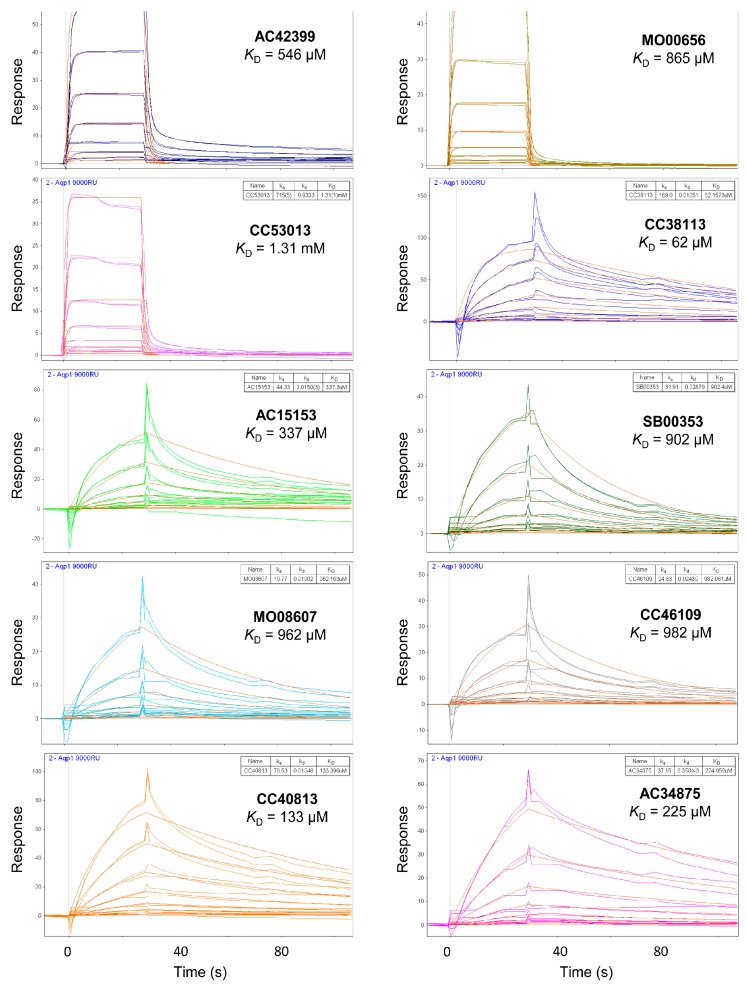
Figure 5.
SPR sensorgrams of the top 10 hit fragments against hAQP1 shown in Figure 4. The y-axis represents response unit (RU) and the x-axis represents time (s). Each fragment was tested in a 2-fold dilution from 6.25 to 800 µM. The steady-state signals plotted as a function of concentration was globally fitted to a typical 1:1 steady-state binding model, giving the binding affinities (KD) based on 50% occupancy. Experimental data has a different color for each sample, whereas fitted curve is shown in orange.

