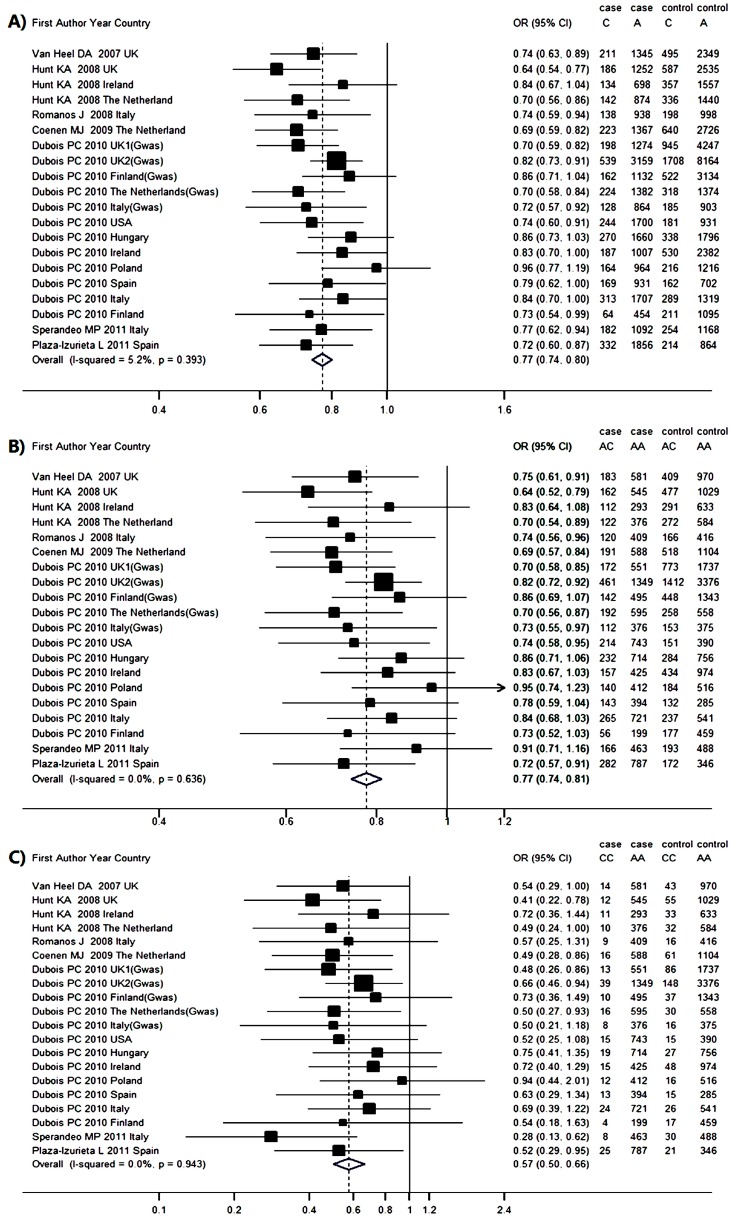
Figure 2.
Meta-analysis forest plots of the correlations between RGS1 rs2816316 and celiac disease: (A) C vs. A; (B) AC vs. AA; and (C) CC vs. AA. The vertical dotted line and solid line represent the pooled odds ratio (OR) and the OR equals to 1, respectively. The horizontal solid lines mean the confidence intervals (CI) of OR in each population. And if the upper limit of OR exceed the top scale, arrow would replace the solid line. The size of solid squares corresponds to the weight of the study in the meta-analysis. The length of the hollow diamonds represent the CI of the pooled OR.

