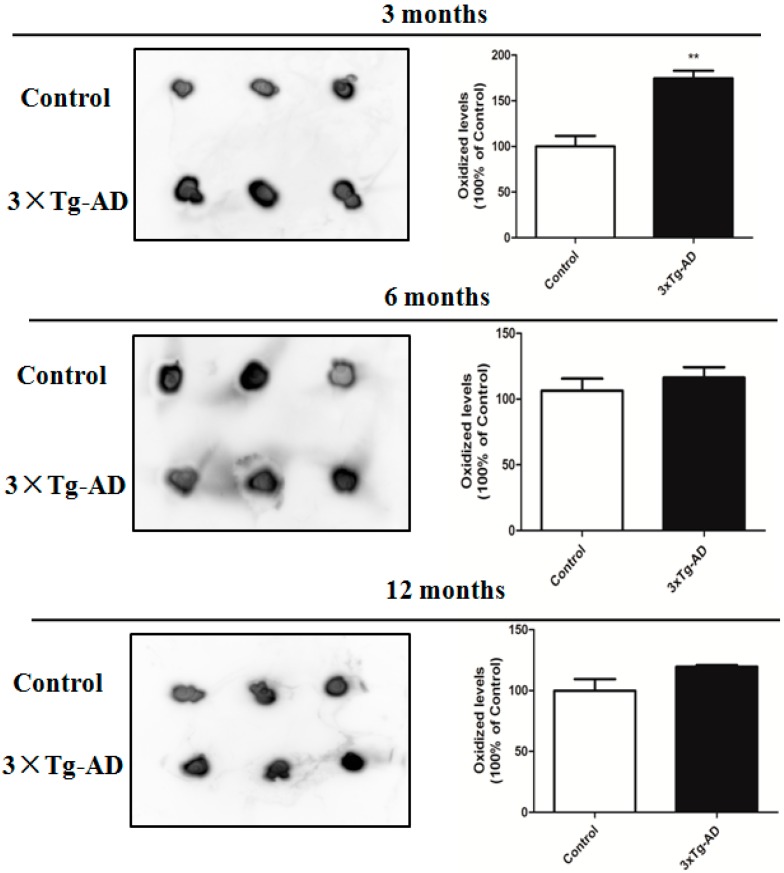
Figure 1.
Total protein carbonylated levels in the serum of 3×Tg-AD mice compared with their controls at three, six, and 12 months of age. Slot-blot detection of protein carbonyls (left). The histogram shows the alteration of protein carbonylated levels (right). The level of protein carbonyls is normalized with the mean of the controls (n = 3). ** p < 0.05, statistically significant difference compared with the control.

