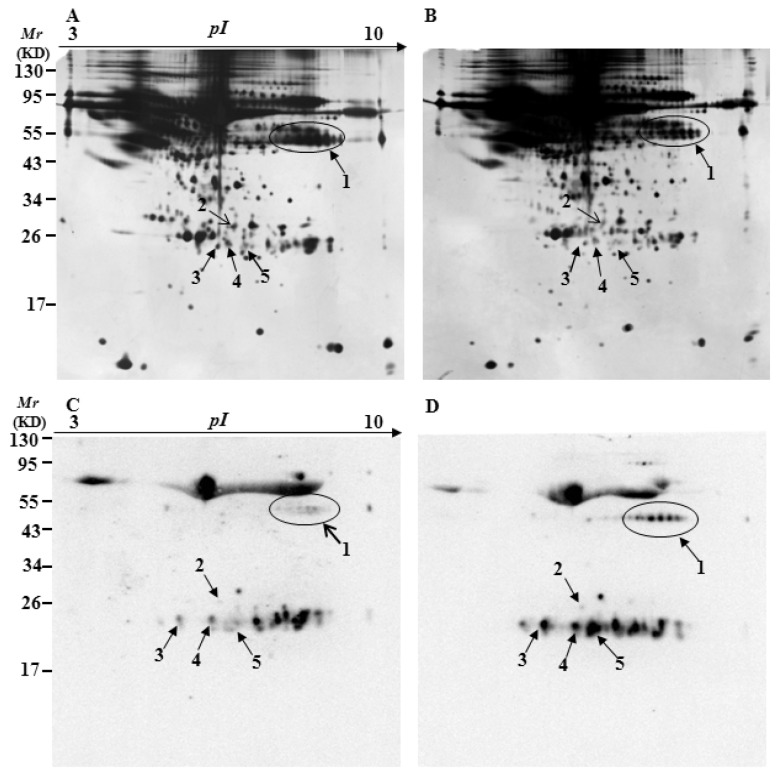
Figure 3.
Silver-stained gels and 2D-oxyblots of serum extracts from the three-month-old controls to 3×Tg-AD mice. Representative 2D gel images of the serum proteomes of control (A); and 3×Tg-AD mice (B); (C,D) represent the oxyblots of serums from the control to 3×Tg-AD mice, respectively. Spots that showed a significant difference in specific carbonylation levels are marked with the corresponding protein identity.

