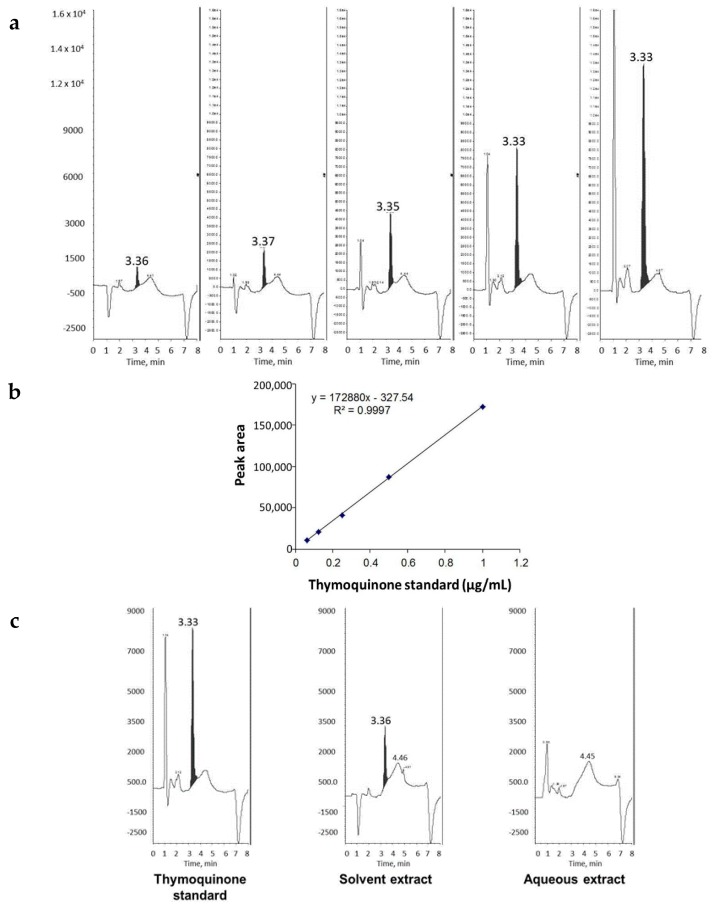
Figure 1.
Detection and quantitation of THQ extracted from black seeds. (a) HPLC analysis of pure THQ standards in increasing concentrations (left to right); (b) calibration curve for pure THQ. The graph shows good linearity, indicating the power of THQ detection and quantitation by HPLC analysis; and (c) HPLC detection of THQ in solvent extract and aqueous extract of black seeds in comparison to THQ standard. Note the absence of THQ in aqueous extract.

