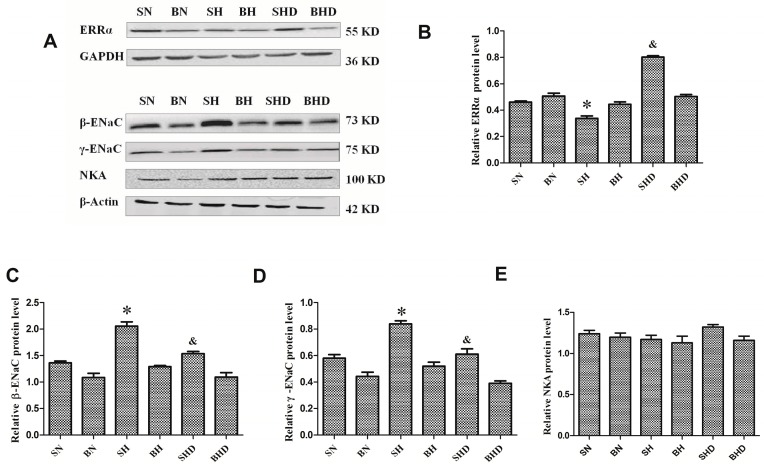
Figure 3.
Expressions of ERRα, Na-K-ATPase, β-ENaC and γ-ENaC in rats. * p < 0.05, compared with BH, SN, and SHD groups. & p < 0.05, compared with BHD group. (A) protein expressions in all groups; (B) relative quantitative analysis of ERRα protein level; (C) relative quantitative analysis of Na-K-ATPase protein level; (D) relative quantitative analysis of β-ENaC protein level; (E) relative quantitative analysis of γ-ENaC protein level.

