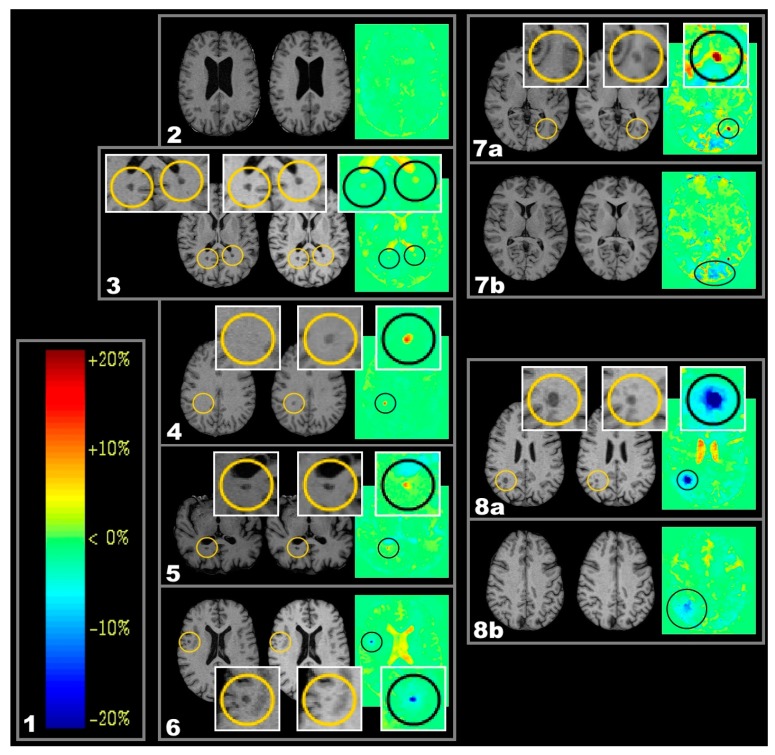
Figure 1.
One year follow-up T1-weighted (T1w)) magnetic resonance images (MRI) and respective colour coded voxel-guided morphometry (VGM) maps demonstrating different types of volume change. Important detail is highlighted in circles. (1) Colour scale encoding of VGM data. On the right, the volume alteration is given in ten-percent-intervals; on the left, the according colours as depicted in VGM images are given. Stability of brain volume (equivalent to a volume change of 0%) is represented by a light green colour; volume reductions (volume change < 0%) are represented by cold colours, and volume expansions (volume change > 0%) by warm colours; (2–6) From left to right: MRI-1), MRI-2), and VGM; (2) Exemplary case demonstrating lack of volume change; (3) Exemplary case demonstrating two inactive lesions, each located close to the posterior horn of the lateral ventricle. They show low volume increase below the cut-off point (light yellow in VGM); (4) Exemplary new lesions (NL) (red in VGM and new in MRI-2) located in the right centrum semiovale; (5) Exemplary chronic enlarging lesions (CEL) (red in VGM and enlarged in MRI-2) dorsal to posterior horn of the right lateral ventricle; (6) Exemplary chronic shrinking lesions (CSL) (blue in VGM and shrunken in MRI-2); (7a–7b) Exemplary NL that involving fibers of the optic radiation (7a). The dependent occipital area shows signals of volume decrease (7b); (8a–8b) Exemplary CSL with light blue halo indicating shrinkage effects along beyond the originally visible lesion (8a); this is even visible in a neighbouring slice that did not contain the original lesion (8b).

