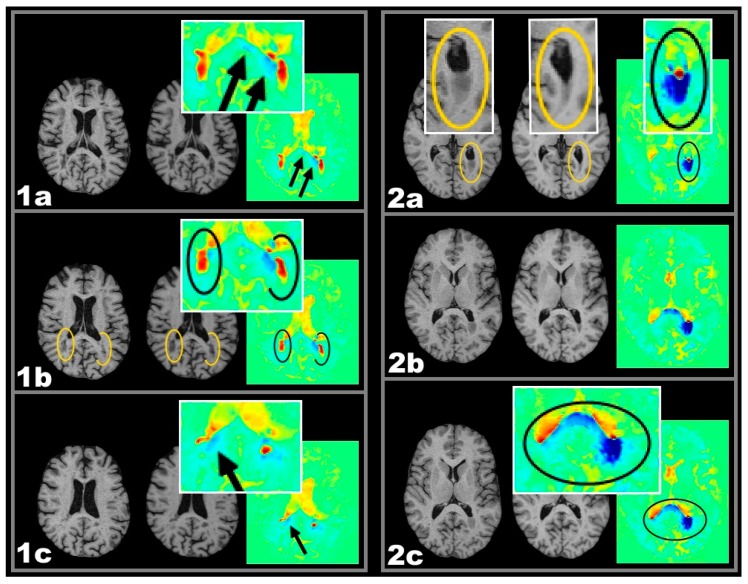
Figure 2.
One year follow-up T1w MRI and respective colour coded VGM maps demonstrating different types of volume change. Important detail is highlighted in elipses. Two exemplary cases with active lesions and spatially related callosal volume decrease: Case 1 CEL, Case 2 CSL. From left to right: MRI-1, MRI-2, and VGM. Case 1 CEL: (1a–1c) Three slices showing bilateral CELs (ellipses in 1b) close to the posterior horns of the lateral verntricles while callosal shrinkage is observed (arrows in 1a and 1c) seen as blue colors; Case 2 CSL: (2a–2c) Three slices showing a periventricular CSL at the posterior horn of the left lateral ventricle. Adjacent callosal fibers show a volume reduction in the splenium of the corpus callosum. This callosal volume reduction extends to the contralateral hemisphere (2c). Important detail is highlighted in circles.

