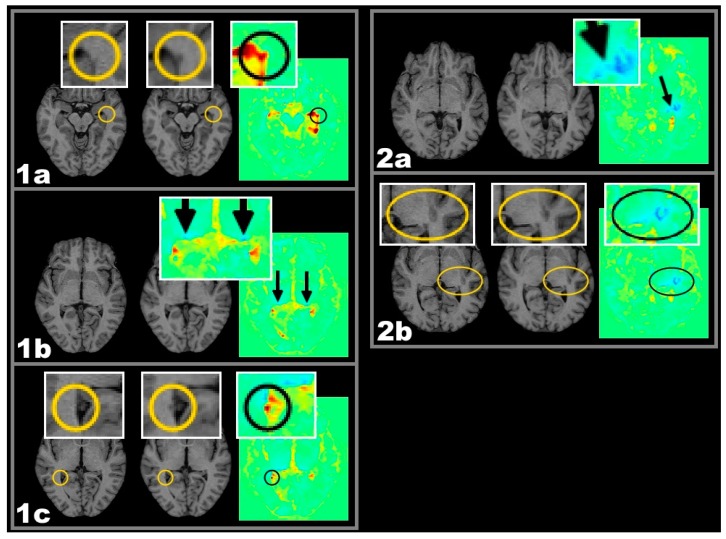
Figure 3.
One year follow-up T1w MRI and respective colour coded VGM maps demonstrating different types of volume change. Important detail is highlighted in circles and elipses. Two exemplary cases with active lesions and spatially related lateral geniculate nucleus (LGN) volume decrease: Case 1 CEL, Case 2 CSL. From left to right: MRI-1, MRI-2, and VGM. Case 1 CEL: (1a–1c) Both LGN of this patient are showing a circumscribed blue VGM signal indicating >5% volume loss (1b). Along the optic radiation, this is accompanied by CEL appearance within the left (1a) and by NL appearance within the right (1c) hemisphere; Case 2 CSL: (2a–2c) The left LGN area of this patient shows a decrease in size. Lateral to the LGN almost contacting the insular cortex, a CSL is visible with a streak of volume decrease between lesion and LGN (2a) possibly representing atrophic fibres of the optic radiation. Important detail is highlighted in boxes and circles. LGN is highlighted by arrows.

