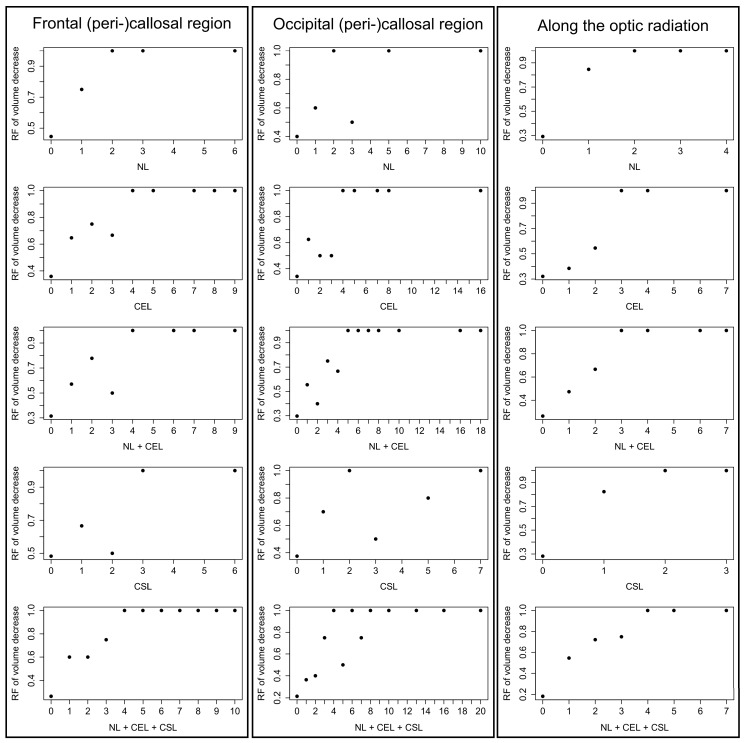
Figure 4.
Relative Frequencies (RF) of volume decrease at given lesion counts in individual patients. The left column lists the number of lesions (x-axis) in the frontal (peri-)callosal region and the relative frequency of callosal volume reduction (y-axis). The center column considers lesions in the occipital (peri-)callosal region and the relative frequency of callosal volume reduction. The right colum considers lesions in the region along the optic radiation and volume decrease of the LGN.

