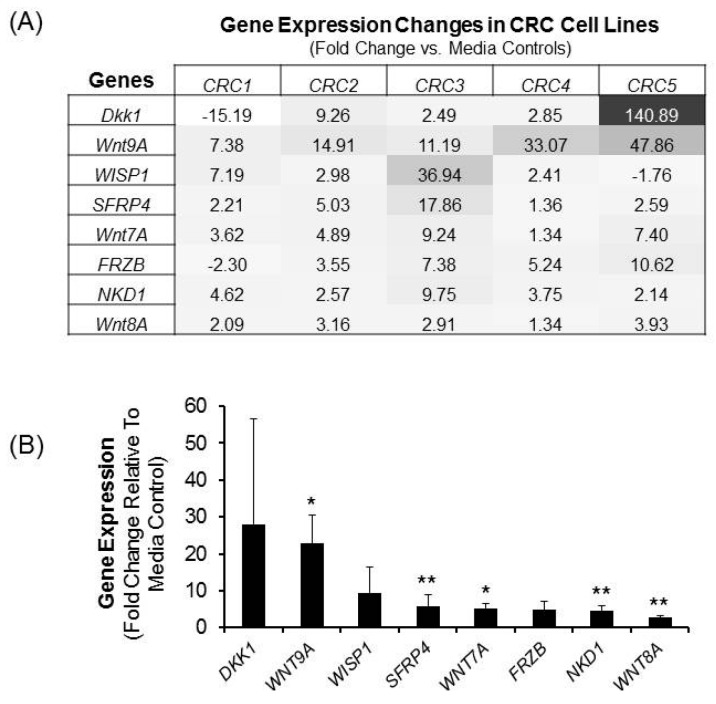
Figure 3.
The effect of LiCl on the expression of Wnt signaling components. CRC cells were treated with 20 mM LiCl for a period of 72 h and gene expression analysis was performed. (A) Heat map showing the intensity of Wnt pathway gene expression changes induced by LiCl in all five CRC cells. Data shown is of gene expression changes of two-folds or greater in four or all five cell lines; (B) Summary of the LiCl-mediated changes in gene expression from the heat map in panel A. The data are expressed as means ± SEM. of fold change relative to media control from 5 distinct CRC cell lines. Statistical analysis: Student’s t-test. * p < 0.025; ** p < 0.01; n = 5. The intensity of gene expression increases from white to black with the black color representing genes expressed the greatest.

