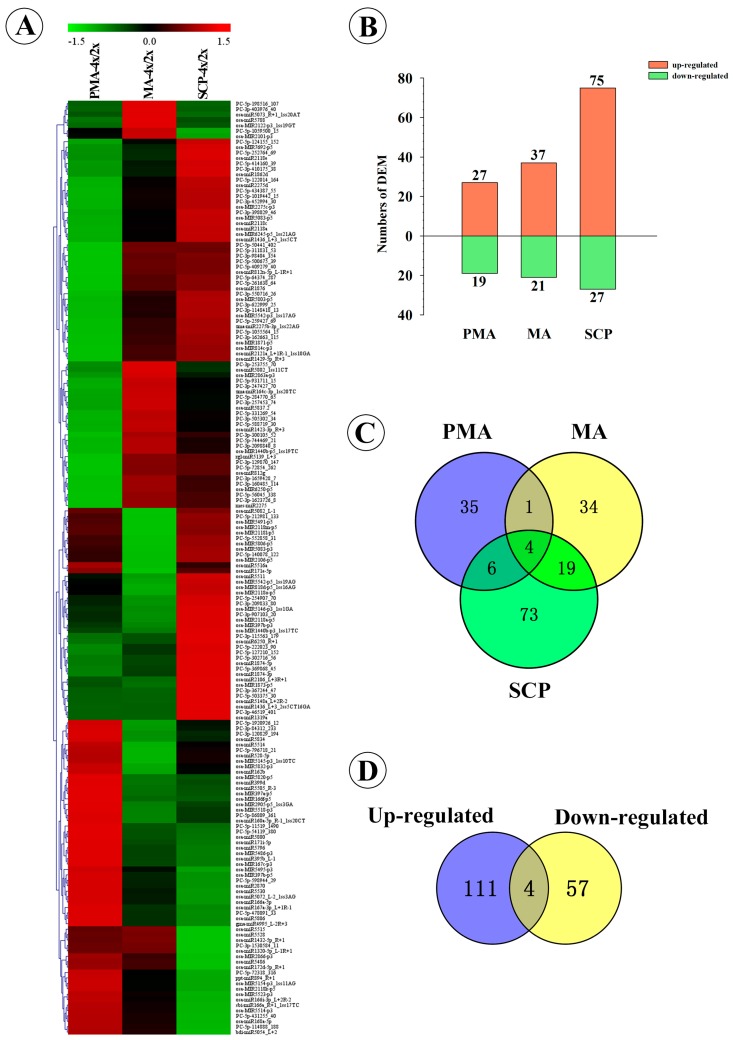
Figure 3.
Analysis of DEM (differentially expressed miRNAs) in Taichung65-2x and Taichung65-4x during pollen development. (A) Hierarchical cluster analysis of DEM. The hierarchical clustering tree of 172 DEM in different libraries of pollen development was constructed by MultiExperiment View (version 4.9). Each column represents the difference between Taichung65-2x and Taichung65-4x in each stage. Red and green represent the up- and down-regulated miRNAs, respectively. The scale bar indicates the relative expression levels of miRNAs (log2); (B) The number of DEM at different pollen development stages; (C,D) Venn analysis of DEM during pollen development. PMA, MA and SCP represent pre-meiotic interphase, meiosis and single microspore stage, respectively. “4x” and “2x” represent the autotetraploid and diploid rice, respectively.

