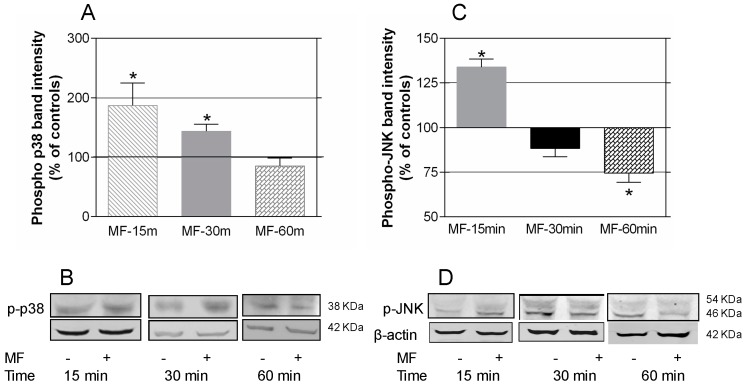
Figure 4.
Western blotting quantification of MAPK-p-p38 and -p-JNK protein expression after short-term exposure to the MF. (A) Expression of phosphorylated-p38 after 15, 30 or 60 min of MF- or sham-exposure. The data, normalized over the corresponding controls (line 100%), are means ± SEM of at least four experimental replicates. Statistically significant differences with respect to controls: 0.01 ≤ * p < 0.05 (Student’s t-test.); (B) Representative blots for p-p38 after MF- or sham-exposure, using β-actin as loading control; (C) Expression of phosphorylated-JNK. Means ± SEM of four experimental repeats, normalized over controls (line 100%) Statistically significant differences with respect to controls: 0.01 ≤ * p < 0.05 (Student’s t-test.); (D) Representative blots at the different MF- or sham-exposure intervals. The p-JNK band is the one showing a 46 KDa molecular weight.

