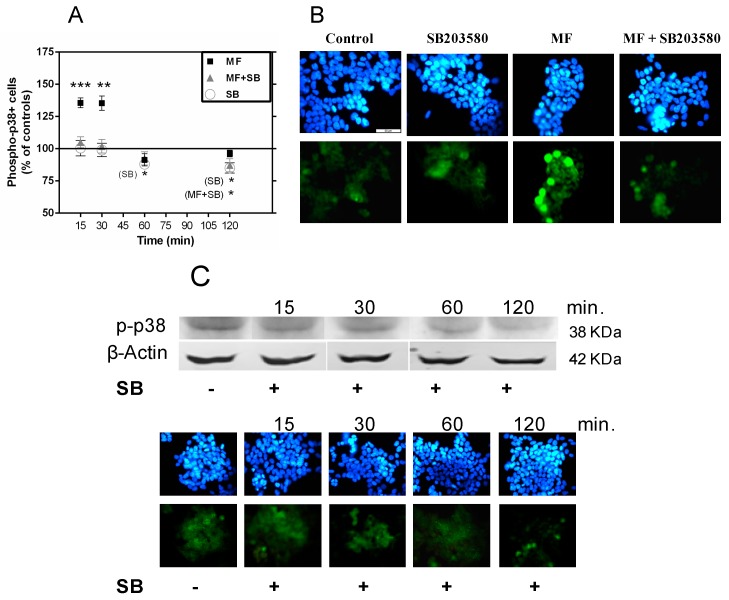
Figure 5.
Quantification of phospho-p38-labeled cells after short-term MF exposure. (A) The data, obtained by computer-assisted analysis of immunocytochemical images, are normalized over the respective controls. Each point corresponds to the mean ± SEM of four experimental replicates. Four conditions were tested: sham-exposure of untreated controls (line 100%), MF exposure only, and p-p38 inhibitor SB203580 treatment, alone (SB) or combined with MF (MF + SB). Statistically significant differences with respect to controls: 0.01 ≤ * p < 0.05; 0.001 ≤ ** p < 0.01; *** p < 0.001 (ANOVA and Student’s t-test); (B) Representative images of immunocytochemical staining for phospho-p38 (lower panels) in controls, in cells exposed to MF for 15 min, in samples treated with the inhibitor onlyand in samples treated with MF + SB203580 for 15 min. All cell nuclei were stained with Hoechst (upper panels); (C) The specificity of SB203580 as MAPK-p38 inhibitor was assessed by p38 phosphorylation assay, showing that 10 µM inhibitor induced a time-dependent reduction of the spontaneous activation of p38. Representative images of immunoblots (upper panel) and immunocytochemistry (lower panel). Scale bar = 50 µm.

