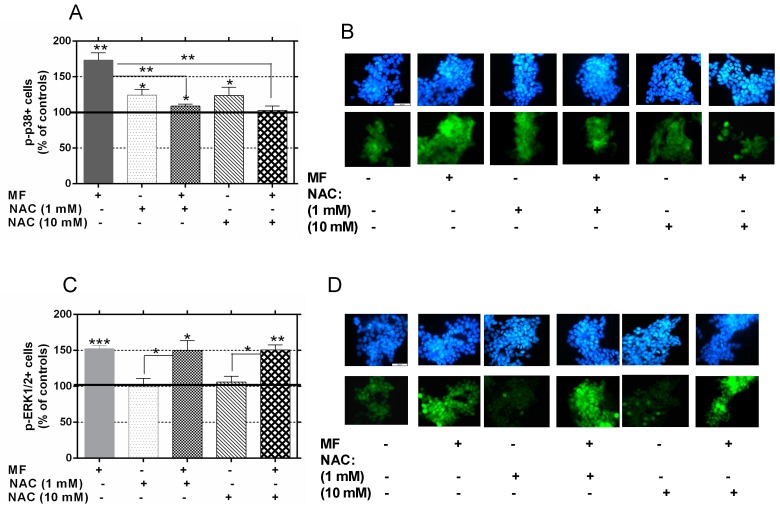
Figure 7.
Expression of p-p38 and p-ERK1/2 after 30-minute MF exposure in the presence of 1 or 10 mM NAC. Immunocytochemistry and computer-assisted image analysis. (A) Phospho-p38 positive cells. The data, normalized over sham-exposed controls treated with NAC vehicle (line 100%), are means ± SEM of four replicates per experimental condition. Statistically significant differences with respect to controls: 0.01 ≤ * p < 0.05; 0.001 ≤ ** p < 0.01; *** p < 0.001 (ANOVA and Student’s t-test); (B) Representative images of immunocytochemical staining for p-p38 (lower panels) in control, NAC (1 or 10 mM), MF exposed or MF + NAC samples. Cell nuclei (upper panels) were Hoechst stained; (C) Phospho-ERK1/2 positive cells. The data, normalized over controls (line 100%), are means ± SEM of four replicates per experimental condition. Statistically significant differences with respect to controls: 0.01 ≤ * p < 0.05; 0.001 ≤ ** p < 0.01; *** p < 0.001(ANOVA and Student’s t-test); (D) Representative images of immunocytochemical staining for p-ERK1/2; same notations as in (B). Scale bar = 50 µm.

