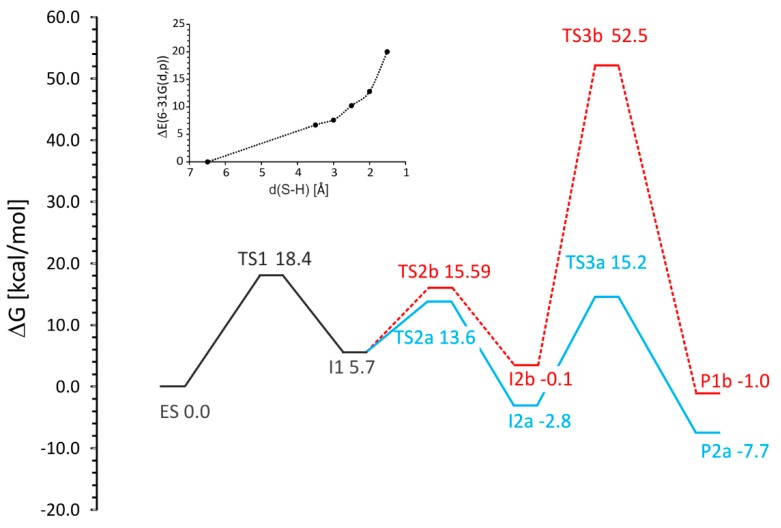
Figure 8.
The Gibbs free energy profile obtained for pro(R) pathway with two variants (a)—solid blue line and (b)—dashed red line. The solid black line depicts a common part for both variants (i.e., ES-I1). The small panel depicts the distance dependence of electronic energy values from scanning intermediates of a gradual approach of bound toluene towards the Cys493 radical before reaching the enthalpy value of TS1.

