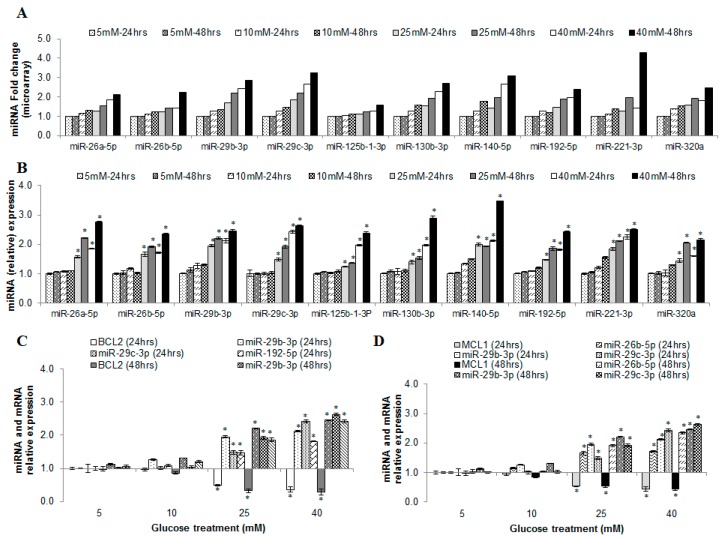
Figure 4.
Validation of selected miRNAs and target mRNAs using qPCR. (A) Represents the pattern of expression observed for the 10 selected miRNAs from the microarray data for HUVECs treated with different glucose treatments for 24 and 48 h; (B) Verification of microarray data in (A) by real-time quantitative PCR; (C,D) The expression level of three miRNAs and their corresponding mRNAs that are involved in apoptosis: (C) miR-29b-2p and -192-5p against BCL2 mRNA and (D) miR-26b-5p and -29b-3p against MCL-1 mRNA. Data are presented as mean ± SEM (n = 3). * indicates statistical significance at p < 0.05 using t-test against control (test vs. 5 mM glucose treatment).

