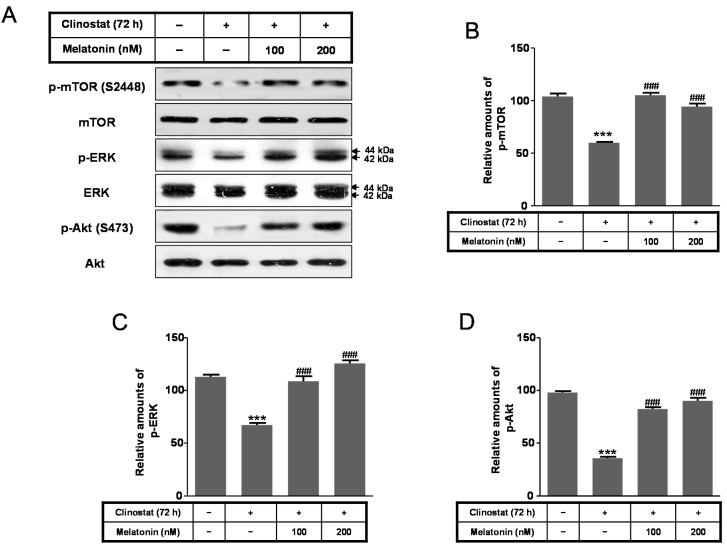
Figure 3.
Phosphorylation of mTOR, ERK, and Akt with clinostat rotation and/or melatonin treatment in MC3T3-E1 cells. MC3T3-E1 cells were cultured in α-MEM added with 10% FBS at 37 °C with 5% CO2. To experimentally simulate microgravity with the 3D clinostat, cells were cultured in T-25 cell culture flasks completely filled with a 1:1 mixture of α-MEM and Leibovitz’s L-15 supplemented with 10% FBS and 1% PS, with or without melatonin (100, 200 nM). Phosphorylation of mTOR, ERK, and Akt was then performed by Western blot analysis (A); the relative expressions of p-mTOR (B); p-ERK (C); and p-Akt (D) were carried out as described in the Materials and Methods section. Values in representative results are shown as means ± SD of at least three independent experiments. *** p < 0.001 vs. No clinostat; ### p < 0.001 vs. clinostat.

