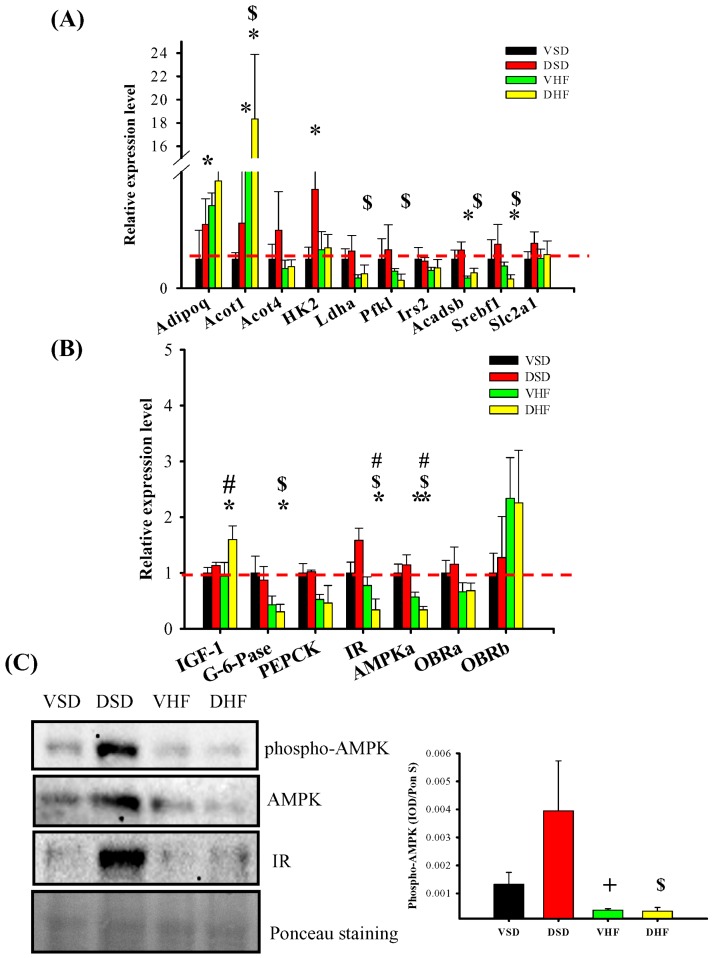
Figure 3.
Hepatic mRNA transcript levels and adenosine monophosphate-activated protein kinase (AMPK) and phsopho-AMPK protein levels: (A,B) hepatic mRNA transcript levels; and (C) hepatic AMPK and pAMPK protein levels. The red dotted line represented that the relative gene expression was 1 when compared to VSD group. Adipoq, adiponectin; Acot1, Acyl-CoA thioesterase 1; Acot4, Acyl-CoA thioesterase 4; HK2, Hexokinase 2. Ldha, Lactate dehydrogenase A; Pfk1, 6-phosphofructokinase; Irs2, Insulin receptor substrate 2; Acadsb, Acyl-CoA dehydrogenase; Srebf1, Sterol regulatory element-binding transcription factor 1; Slc2a1, Solute carrier family 2, member 1; IGF1, Insulin-like growth factor 1; G-6-Pase, Glucose 6-phosphatase; PEPCK, phosphoenolpyruvate carboxykinase; IR, Insulin receptor; AMPKa, AMP-activated protein kinase alpha; OBRa, leptin/obese receptor a; OBRb, leptin/obese receptor b. Data were compared by two-way ANOVA followed with post hoc least significant difference tests. * vs. VSD, p < 0.05; $, DSD vs. DHF, p < 0.05; #, VHF vs. DHF, p < 0.05; +, DSD vs. VHF, p < 0.05.

